Aerospace teams do not raise an NCR because paperwork is convenient. They raise it because a deviation has appeared in a system where product quality, airworthiness, schedule, and regulatory compliance are tied together. A non conformance report ncr is the controlled mechanism for making that deviation visible, contained, investigated, and effectively resolved.
This guide explains the aerospace ncr process from detection through containment, MRB, CAPA handoff, root cause analysis, and verified closure. It is written from Connect981’s perspective as an aerospace operations platform that digitizes NCR workflows across factories, MRO lines, and suppliers.
Overview of the Aerospace NCR Process Workflow
A Nonconformance Report (NCR) is a controlled quality record used to formally document, investigate, and resolve nonconformities identified during any phase of the product or service lifecycle. In aerospace manufacturing and MRO, the non conformance report is part of the quality management system and is central to meeting AS9100, FAA, EASA, OEM, and customer requirements. The aerospace industry requires strict adherence to quality standards to ensure regulatory compliance and airworthiness certifications.
The lifecycle of an aerospace NCR includes identification, segregation, documentation, evaluation, and disposition of non-conforming parts. The typical nonconformance report process follows a structured workflow that begins with detection and initiation by QA, production, or inspection teams, followed by documentation, containment measures, assessment, investigation, and closure. Quality standards, such as AS9100 for aerospace, require organizations to manage nonconformities and take corrective actions to ensure compliance and continuous improvement.
At a practical level, what happens after an NCR is raised is straightforward: the item is controlled, the risk is classified, relevant stakeholders are notified, MRB is involved when required, corrective and preventive actions are assigned, objective evidence is verified, and the audit trail is closed. Immediate containment means physical and digital action on the shopfloor to stop non conforming products from moving forward. MRB gets involved for major non conformance, design deviation, certified configuration, or flight safety concerns. CAPA should start when the issue is major, recurring, customer-facing, or systemic. Closure timing should be governed by severity, due dates, aging reports, and quality manager escalation.

What Is a Non Conformance in Aerospace Operations?
Aerospace non conformance is any deviation from design data, process specification, regulatory requirement, or customer contract. It can be an Airbus A350 frame misdrill, a missed torque spec on a CFM56 fastener, incomplete maintenance sign-off on a 737 landing gear overhaul, or any condition where the work does not meet specified requirements. NCRs are essential for documenting deviations from approved specifications, procedures, or regulatory requirements, which is critical for maintaining quality standards in aerospace manufacturing.
Non conformance usually falls into three categories:
- Product non conformance: dimensional failures, wrong material, incorrect configuration, damaged parts, or nonconforming heat treatment.
- Process non conformance: unapproved sequence, skipped inspection, expired calibration, missed cure parameter, or unauthorized repair method.
- Documentation non conformance: missing EASA Form 1, incomplete FAA Form 8130-3, outdated work instruction revision, weak document control, or missing sign-off.
Organizations should categorize non-conformances as minor or major to prioritize corrective actions effectively, ensuring that minor issues are addressed promptly to prevent them from escalating into major problems.
- Minor non conformance: paint blemish not affecting corrosion protection, reworkable edge break, label misalignment, or documentation typo with no airworthiness impact.
- Major non conformance: primary structure out of tolerance, missing required inspection, wrong alloy or heat treat on load-bearing parts, or work performed to the wrong drawing revision.
- Safety-critical non conformance: crack in flight-critical hardware, unapproved repair on certified structure, or any issue that may compromise quality and safety standards.
A documented process for identifying non conformance is required under AS9100 expectations. In the aerospace sector, compliance with AS9100 requires organizations to implement non-conformance reporting procedures to address any deviations from established quality standards and regulatory requirements. Regulatory requirements for non-conformance reporting are defined in international standards such as ISO 9001, AS9100 for aerospace, IATF 16949 for automotive, and FDA regulations for healthcare and medical devices. Non-conformance reporting procedures are mandated by various regulations to ensure that organizations consistently identify, document, and resolve deviations from quality standards, thereby maintaining compliance and product safety. In other sectors, including construction projects, NCR terminology is also used, but aerospace risk, traceability, and airworthiness requirements are materially higher.
Step 1 – Detect and Record the Non Conformance
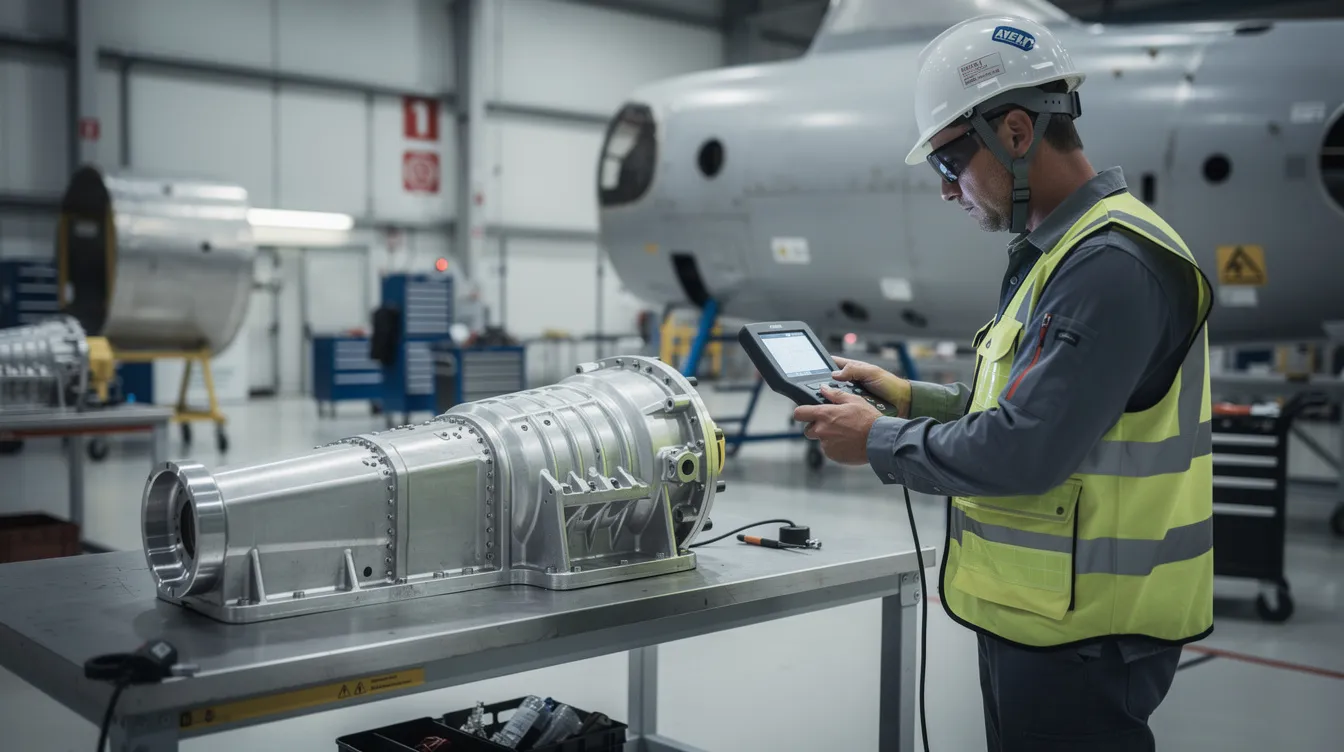
The ncr process begins the moment anyone identifies a deviation. That may happen during first article inspection, in-process inspection, supplier receiving, line maintenance, heavy check, customer complaints about delivered hardware, internal audits, or regulator findings from FAA and EASA oversight. Quality assurance and quality control teams need a clear route to document non conformities without waiting for informal approval.
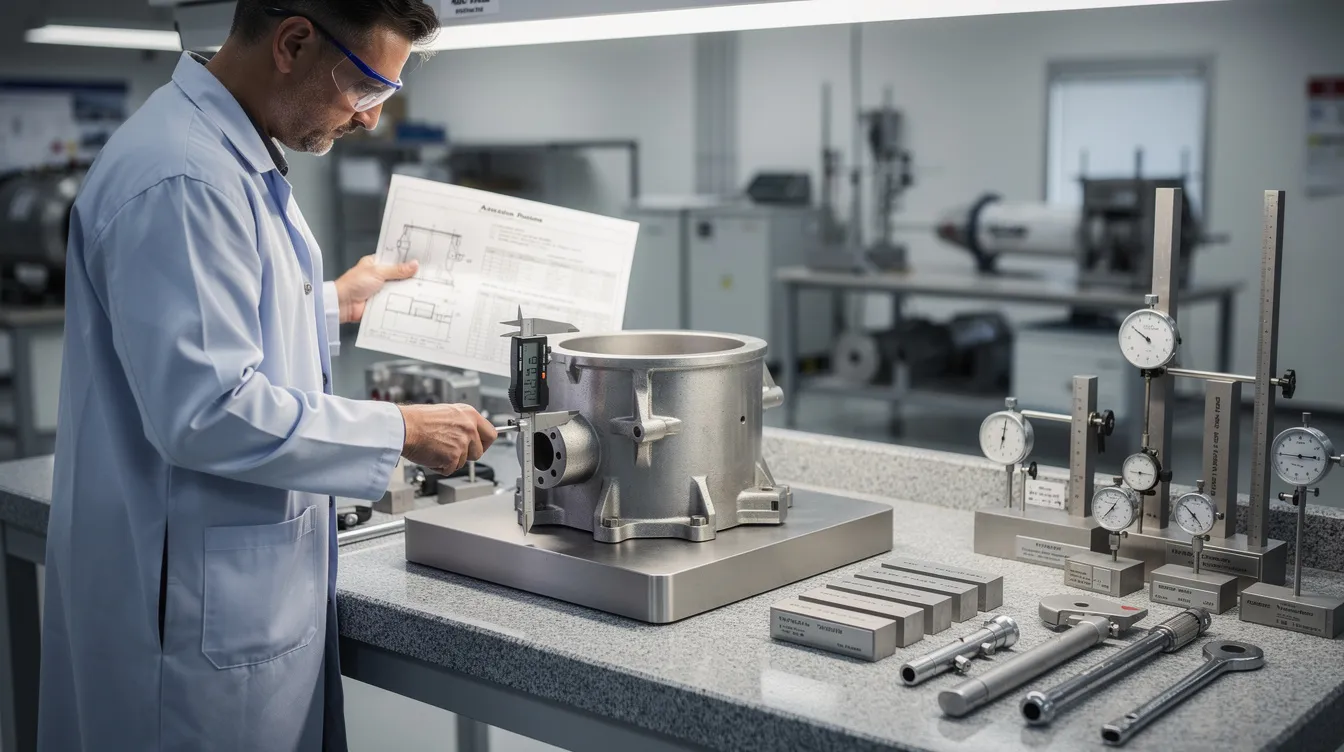
Typical detection sources include CMM inspection failures, NDT rejects on structural components, torque audits, shopfloor operator observations, reliability program field events, and inspection data from MRO teardown. An effective non conformance report should capture the key elements at creation: date and time, facility, work center, work order or tail number, part number, serial number, batch, drawing or specification reference, detailed description, severity estimate, immediate status, applicable requirements, and an impact assessment to identify all potentially affected items. Effective non-conformance reporting requires clear documentation of the non-conformance, including a description of the issue, the applicable requirements, and the impact assessment to evaluate potentially affected items.
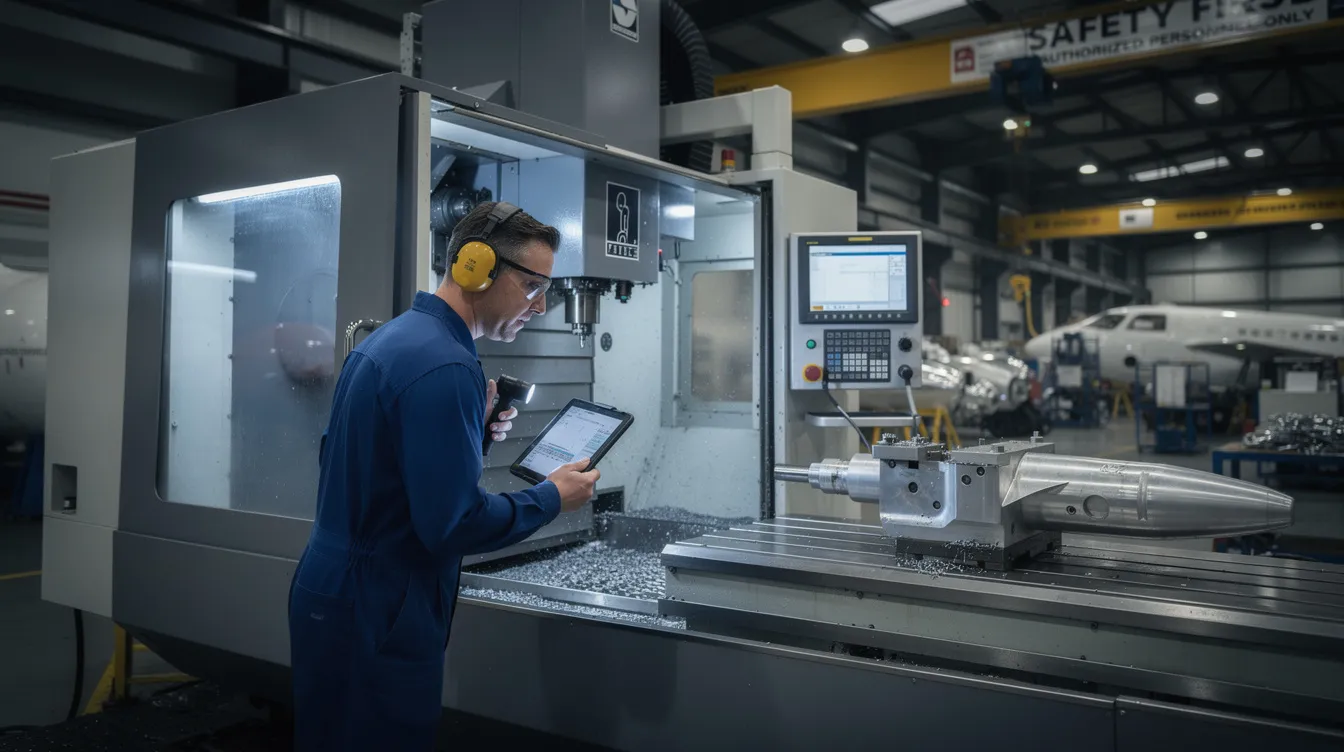
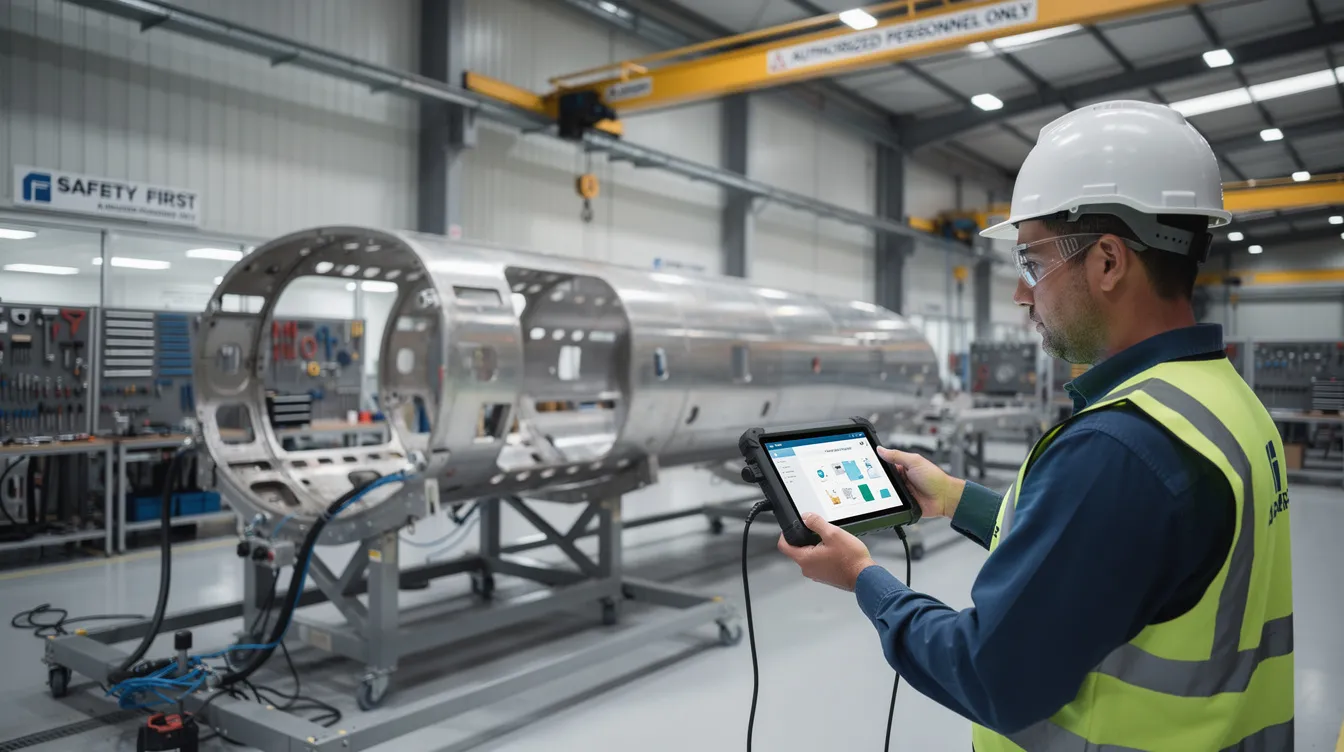
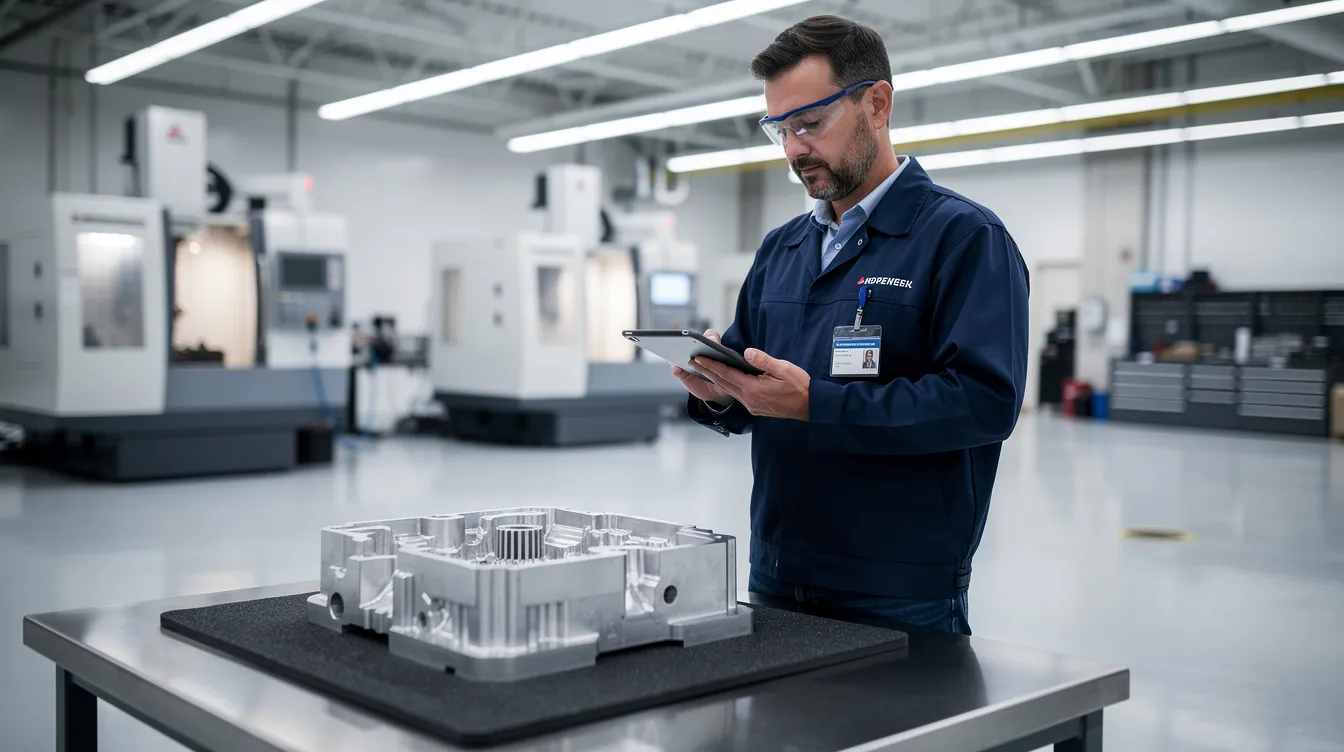
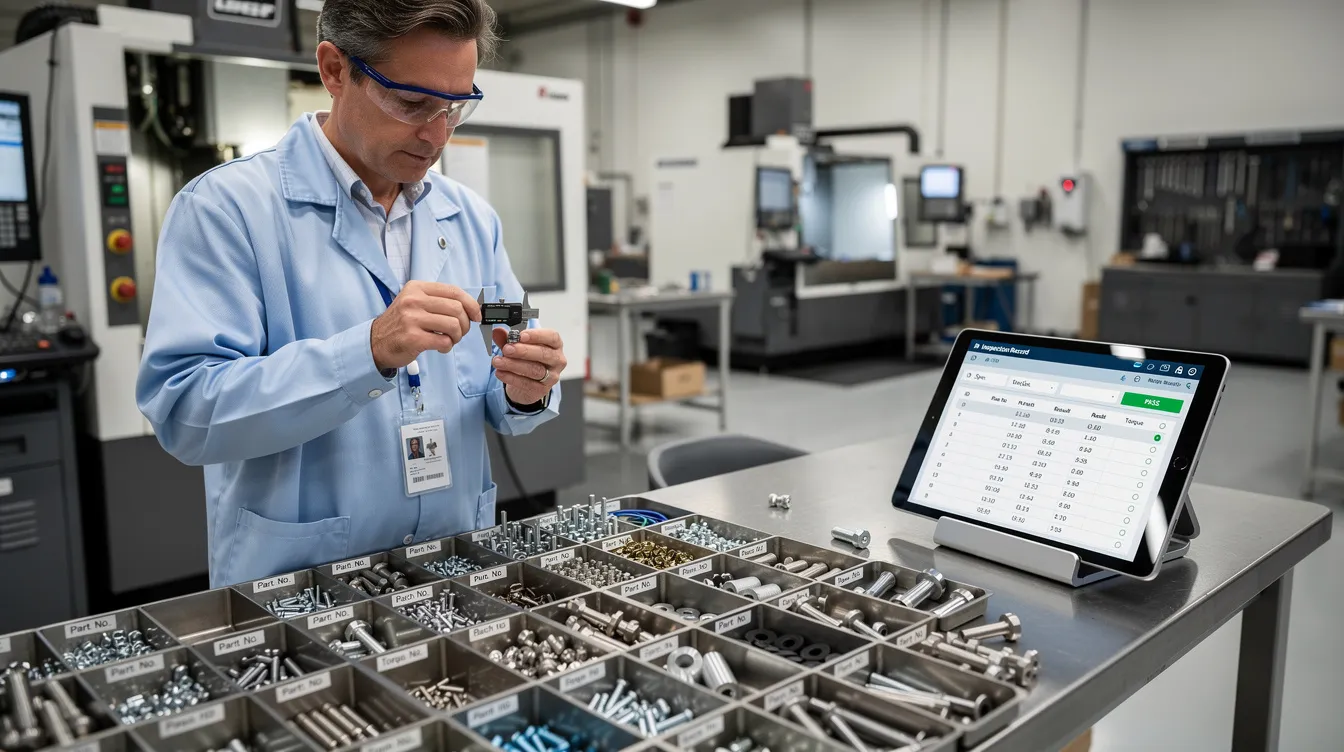
Operators and inspectors must identify non conformance and open the NCR immediately. Quality engineers validate the finding, confirm proper documentation, and ensure the record enters a controlled NCR log. With Connect981, the NCR can be raised directly from a work order or inspection step using tablets or terminals. The platform pulls live part numbers, revision-controlled instructions, process records, and quality data so teams avoid rekeying errors and maintain instant traceability.
Step 2 – Immediate Containment and Segregation
Immediate containment is the set of actions taken within hours of detection to prevent further use of nonconforming parts, processes, or documents while the investigation proceeds. The NCR process is critical to maintaining flight safety and regulatory compliance in the aerospace sector because it ensures defective components never make it onto an aircraft, thereby preventing catastrophic failures.
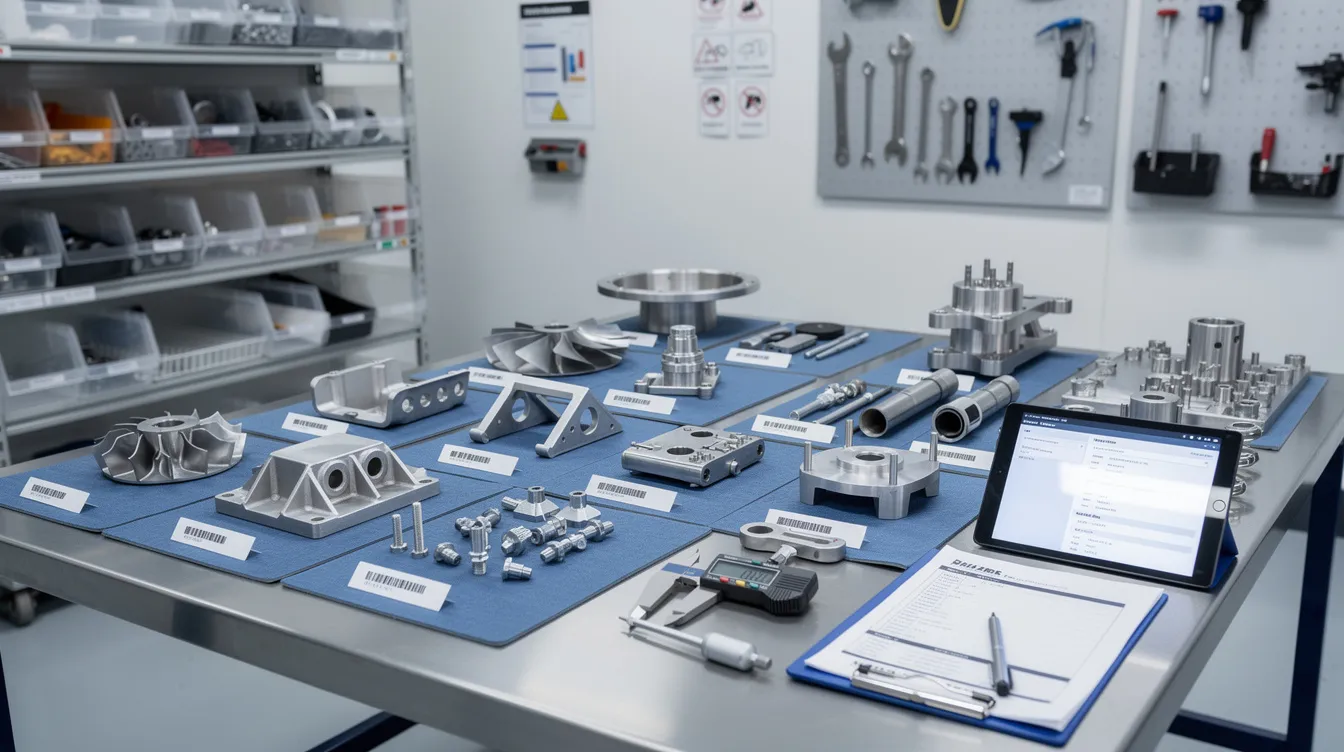
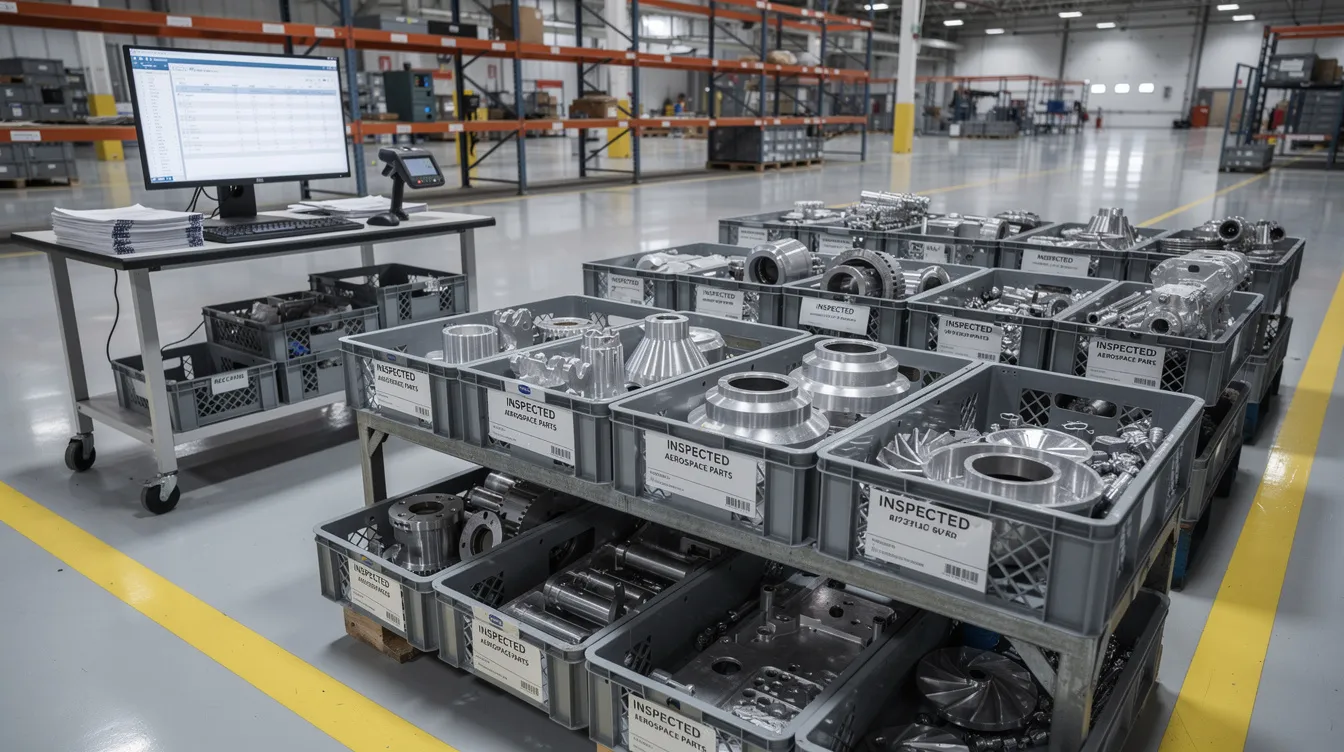
Containment includes tagging suspect parts, moving them to a quarantined MRB area, applying electronic holds in MES or ERP, freezing affected serial numbers and lots, and stopping use of an out-of-tolerance fixture or expired adhesive batch. Physical segregation of non-conforming parts prevents contamination of the aircraft assembly line and protects the production process from silent propagation of defects.

Good containment also brackets the impact. Teams check previous and subsequent serial numbers, adjacent lots, recent jobs on the same tooling, and maintenance tasks on the same aircraft system. Production supervisors authorize stop-work, quality ensures physical and digital segregation, planning adjusts routing or schedules, and supply chain is notified if supplier material is involved. Connect981 supports this with real-time status flags, automated alerts to MRB and planners, and an audit trail showing who applied each hold and when.
Step 3 – Evaluate, Classify, and Decide on MRB Involvement
Once contained, the non conformance is evaluated for risk, scope, regulatory impact, and customer exposure. This classification drives risk management, resource allocation, and the path to disposition.
Minor non conformance may include cosmetic paint defects not affecting corrosion protection, reworkable edge breaks, or documentation errors with no airworthiness impact. Major non conformance includes primary structure out of tolerance, missing required inspection, incorrect material, or wrong heat treatment. The phrase major non matters operationally because it usually changes approval authority and timing expectations.
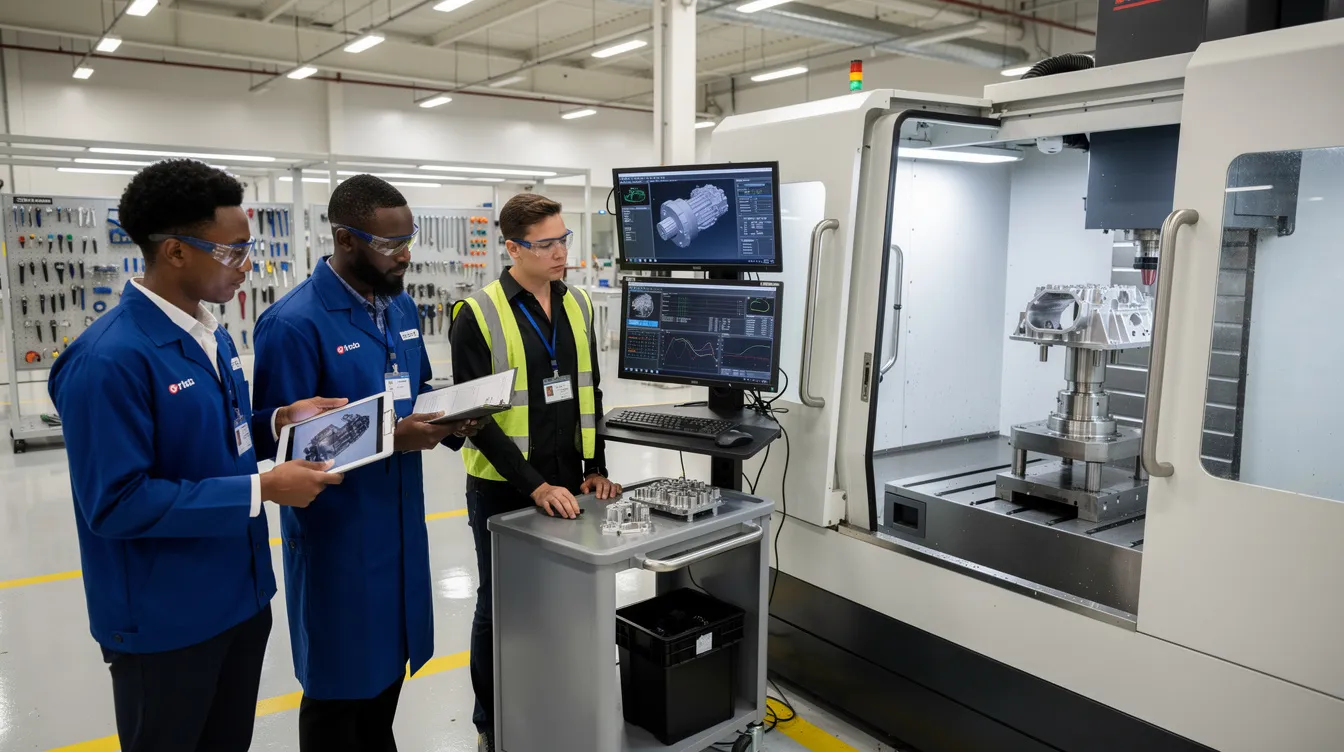
MRB should get involved when there is any major non conformance, design deviation request, repeated minor issue indicating systemic failure, certified configuration impact, airworthiness exposure, or contract flight safety clause. A Material Review Board (MRB) analyzes issues related to non-conforming parts and decides their fate based on defined paths: scrap, rework, repair, or use as-is. MRB membership typically includes the quality manager, design engineering, stress or structures engineering, manufacturing engineering, operations, and sometimes customer or regulatory representatives.
A practical example is an A320 wing panel with undersized fastener holes. MRB may decide to scrap the panel, rework with oversized fasteners, repair under an approved engineering scheme, or use as-is with a design authority concession. Connect981 can route NCRs automatically to the correct MRB group by part family, program, supplier, or customer, then enforce electronic signatures for AS9100, FAA, and OEM audit readiness. AS9100D requirements for control of nonconforming outputs are commonly tied to clause 8.7 and corrective action expectations under clause 10.2, as summarized by AS9100 implementation guidance.
Step 4 – Define Disposition and Handoff to CAPA
MRB or quality leadership must formally decide disposition. Standard aerospace dispositions are:
- Scrap: remove the item from usable inventory, update serial trace, and prevent accidental reinstatement.
- Rework to print: return the part to specified requirements using approved instructions, followed by re-inspection.
- Repair: apply an engineering-approved repair scheme with stress, design, or airworthiness sign-off where required.
- Use-as-is: accept the condition with risk justification, concession, and customer approval where required.
CAPA should start when the issue is a major non conformance, repeated minor non conformance above threshold, tied to customer complaints, linked to field reliability, found by regulator audit, or requiring design concession or notification. The NCR owner, often a quality engineer, retains ownership of the non conformance record. The CAPA owner, often manufacturing engineering, supplier quality, or maintenance engineering, owns systemic corrective and preventive measures.
The handoff must preserve traceability between the NCR, corrective action, corrective and preventive actions, corrective and preventative actions, and preventive actions. Connect981 links NCR and CAPA workflows through the same data model, shared part and serial identifiers, aircraft identifiers, and dashboards showing which NCRs have open CAPA actions versus those cleared for closure. This prevents premature closure and supports complaint handling when customer-facing issues are involved.
Step 5 – Root Cause Investigation and Corrective Actions
For major non conformance and recurring issues, investigation must go beyond “operator error.” Root cause analysis is a structured investigation phase used to determine the underlying cause or combination of causes that led to a nonconformance, ensuring that corrective actions address the root cause to prevent recurrence. RCA may involve cross-functional input from QA, engineering, production, and supply chain, and is performed using validated methodologies like the 5 Whys technique or Ishikawa fishbone diagram.
Typical aerospace RCA examples include 5 Whys on a mis-routed hose installation, fishbone analysis of repeated NDT failures on titanium forgings, fault tree analysis for a flight control component defect, and review of PFMEA and process control plans. The investigation should collect machine programs, revision history, calibration records, batch and heat numbers, technician training and certification records, environmental conditions, cure oven profiles, humidity data for bonding, and change history for drawings and work instructions.
Effective corrective actions may include updating work instructions, adding visual aids, tightening inspection at critical control points, revising torque or cure parameters, retraining and requalifying technicians, updating supplier control plans, or modifying fixtures. The objective of root cause analysis is not only to identify the immediate cause of a nonconformance but also to uncover additional preventive actions for similar processes or areas to avoid future occurrences. Teams must implement corrective actions with due dates, owners, and evidence, not just write a corrective action statement. Connect981 can provide AI-assisted root cause suggestions based on historical NCR patterns, then automatically assign tasks so teams implement corrective and preventive measures with due-date tracking.
Step 6 – Verification, Closure Criteria, and Timing Discipline
NCR closure in aerospace is not a checkbox. Teams must verify that corrective actions were implemented, validated for effectiveness, and that affected hardware, paperwork, and systems were updated before closure. Best practices for closing a Non-Conformance Report (NCR) include verifying corrective actions, validating their effectiveness, documenting closure details, obtaining necessary approvals, and archiving the report for future reference.
Closure criteria should include passing re-inspection or re-test data, updated drawings and work instructions released under configuration control, completed training records, relevant documentation attached, customer approvals where required, and confirmation that CAPA is closed or controlled by verified interim action. The NCR owner verifies objective evidence and recommends closure. The quality manager or MRB chair approves closure. Customer or regulatory representatives sign off when required, for example under specific engine or airframe customer MRB controls.
Closure timing should vary depending on severity and contractual requirements. Many aerospace teams target minor non conformance closure within 30 days and major non closure within 60 to 90 days, with faster containment windows for high-risk events. AS9100 does not prescribe a fixed day count, but it expects action without undue delay. Aging reports, escalation rules, and owner accountability help ensure compliance, verify compliance, and maintain compliance. Connect981 enforces closure discipline with mandatory fields, automated reminders, dashboards by plant, program, and supplier, and exportable audit trail packages.
Roles and Responsibilities Across the Aerospace NCR Lifecycle
A repeatable NCR process depends on clearly defined roles, especially when multiple sites and suppliers contribute to the same aircraft program.
- Operators and technicians identify non conformance, stop affected work when safe, and initiate the NCR.
- Inspectors validate the defect, capture measurements, and support quality control.
- Production supervisors apply containment, authorize station holds, and protect schedule realism.
- Quality engineers own the NCR record, coordinate investigation, and align quality processes with defined procedures.
- Quality managers approve classification, escalation, closure, and better quality management practices.
- MRB members decide disposition and ensure the outcome meets applicable requirements.
- Manufacturing and MRO engineers define rework, repair, and process changes.
- Supplier quality manages supplier-related non compliance, SCAR linkage, and supplier CAPA.
- Program managers monitor schedule, customer commitments, service quality, and resource allocation.
In MRO, maintenance engineers and reliability teams take a larger role because non conformance may be found on in-service aircraft during inspection, teardown, or heavy check. Proper training is essential so each function knows when to raise, route, escalate, and close an NCR.
Traceability, Documentation, and Audit Trail Requirements
Aerospace NCR processes live or die on traceability. Each non conformance must link to parts, serial numbers, lots, heat numbers, work orders, aircraft registrations, process parameters, operator IDs, calibration IDs, drawings, and work instruction revisions. NCR processes create a permanent, auditable paper trail that assists with legal traceability and compliance.
A robust audit trail records the full history of edits and approvals, photos, test reports, MRB minutes, repair schemes, timestamps for creation, containment, MRB, CAPA linkage, verification, and closure. It also cross-references CAPA, SCAR, customer complaint records, process records, and management review inputs. NCRs serve as critical inputs for quality audits, regulatory inspections, and management reviews, ensuring that quality issues are captured, investigated, and resolved in line with defined procedures.
This level of traceability supports product quality, regulatory review, and future investigations. FAA guidance for production approval holders emphasizes traceability and control of articles through production and delivery, while EASA rules emphasize reliable record keeping and retention for airworthiness data. See the FAA’s AC 21-43A and EASA’s initial airworthiness rules for context.
Connecting NCRs to Continuous Improvement in Aerospace
Nonconformance reports are essential for identifying and addressing deviations from quality standards, and they facilitate continuous improvement by documenting issues and corrective actions taken. Continuous improvement in aerospace manufacturing is driven by analyzing trends in NCR logs to identify weak links in supply chains or assembly lines.
Aggregated NCR data can reveal repeated minor non conformance in one cell, recurring supplier issues on titanium forgings, rising customer complaints on a specific LRU, or increased rework after a design change. Teams can use those insights to update control plans, revisit PFMEA, launch kaizen activity around high-defect manufacturing processes, and renegotiate supplier quality agreements based on evidence.
The practical objective is not just to close records. It is to drive continuous improvement, improve customer satisfaction, meet customer expectations, and exceed customer expectations where possible. Corrective actions fix the specific event. Preventive measures and preventive actions reduce the likelihood of future events across similar products, suppliers, or processes.
Digitalizing the Aerospace NCR Process with Connect981
Paper NCR packs, spreadsheets, and disconnected QMS or MES records make aerospace nonconformance management slower than it needs to be. Data is retyped, holds are missed, attachments live in file shares, and closure depends on chasing signatures. That creates avoidable risk for quality management, schedule control, and audit readiness.
Connect981 replaces fragmented NCR handling with an aerospace operations platform designed for connected shopfloor execution and supplier collaboration. Capabilities include digital NCR forms embedded in work instructions, automated routing to MRB and CAPA, ERP and PLM integration for part and configuration data, mobile evidence capture, document control, and dashboards for aging NCRs.

The platform’s zero and low-code workflow builder lets teams mirror their existing non conformance procedure, including customer-specific rules, without a full MES replacement. In a quality management system qms environment, that matters because local procedures, OEM clauses, ITAR constraints, and customer approvals often differ by program.
Connect981 also supports cross-factory and supplier visibility with shared NCR views, controlled access for customer representatives, standardized templates, and non conformance reporting software that preserves high quality standards. The result is a clearer workflow from containment through MRB, CAPA handoff, and disciplined closure.
To see how Connect981 digitizes the full aerospace NCR process across factories, MRO lines, and suppliers, request a demo.