Tag: Connect 981

  • Inventory Accuracy in Aerospace: Cycle Counts, WIP Visibility, and Traceability That Actually Work

    Inventory Accuracy in Aerospace: Cycle Counts, WIP Visibility, and Traceability That Actually Work

    Inventory accuracy aerospace work is not about a neat warehouse report. It is about whether the part the system says is available is physically present, in the right location, with the right serial, lot, condition, revision, and release status.

    In an aerospace plant or MRO shop, a 2 to 3 percent inventory error can stop real operations. One missing life-limited component, one misplaced LRU, or one fastener lot with unclear status can delay flight schedules, extend turn-around-time, and damage customer satisfaction. Picture a 2025 A320 heavy check where a serialized actuator shows “available,” but the unit is actually in a shadow rack, on hold, or already cannibalized for another job.

    This article answers four practical questions: what causes poor inventory accuracy, how cycle counts help, how WIP visibility and traceability controls work together, and which KPIs show whether the system is improving.

    Connect981 approaches this as an aerospace operations platform, not generic retail inventory management software. The focus is line-side, stores, kits, and WIP inventory used in aerospace manufacturing and maintenance, not finished goods in a distribution center.

    An aerospace technician stands beside an aircraft maintenance bay, using a tablet to manage inventory records, while organized parts carts are neatly arranged nearby. This scene highlights the importance of efficient inventory management and accurate tracking systems in maintaining optimal inventory levels for aerospace companies.

    What Causes Poor Inventory Accuracy in Aerospace Environments?

    Poor inventory accuracy usually comes from small process leaks that compound over time. The challenges faced by aerospace companies are rarely one bad count. They are weak handoffs between people, systems, and physical flow.

    Common causes include:

    • Informal “borrow and replace later” habits, where components move without a transaction.
    • Undocumented kitting changes, especially when technicians adjust kits to keep work moving.
    • ERP, MES, spreadsheets, and paper pick tickets showing different inventory records.
    • Delayed backflush, late returns, miscoded scrap, and missing issue transactions.
    • Parts staged in aisles, warehouse space, tool cribs, line-side cabinets, or shadow racks without accurate tracking.
    • Missing serial or lot links to work orders, partial tear-downs, and unlogged cannibalization in MRO.
    • Point-of-use cabinets with stock levels that operators trust more than the system.

    Regulatory compliance raises the stakes. AS9100, FAA, and EASA expectations make traceability, documentation accuracy, safety standards, and configuration control essential. When physical reality and inventory records diverge, teams face audit findings, schedule risk, and potential quality escapes.

    The damage goes beyond accounting. Bad inventory accuracy undermines forecast demand, decision making, customer commitments, and maintaining optimal inventory levels. It also creates excess inventory, poor cash flow, higher holding costs, weaker financial performance, and more emergency buying during supply chain disruptions.

    Cycle Count Discipline: The Fastest Lever to Improve Inventory Accuracy

    Cycle counting is the practical alternative to relying on one annual physical inventory count. Instead of shutting down for a wall-to-wall count, teams perform focused physical counts on critical bins, kits, serialized parts, and WIP locations throughout the year.

    Start with risk:

    • High value serialized parts
    • Customer-furnished equipment
    • Long-lead items
    • Safety-critical hardware
    • Fast-moving line-side stock
    • Locations with repeated discrepancies

    A simple pattern works well: daily checks on critical line-side bins, weekly checks in kitting areas, and monthly deep dives on slow-moving spares. The point is not just counting. The point is using inventory control to find where processes are drifting.

    The basic formula is simple: accurate records divided by records counted. In aerospace, targets should be strict. Aim for more than 99 percent accuracy on serialized, life-limited, and safety-critical parts, and more than 97 percent overall.

    A TriVista case study reported an aerospace and defense facility improving from 10 to 20 percent inventory accuracy after audits to about 97 percent across roughly 8,500 SKUs, using barcoding, standard procedures, and layout improvements. That kind of gain comes from disciplined practices, not spreadsheet cleanup alone.

    Connect981 can surface cycle-count tasks automatically based on value, movement, defect history, and prior discrepancies. It can also record variance at the bin and serial level, giving supervisors real time data they can act on.
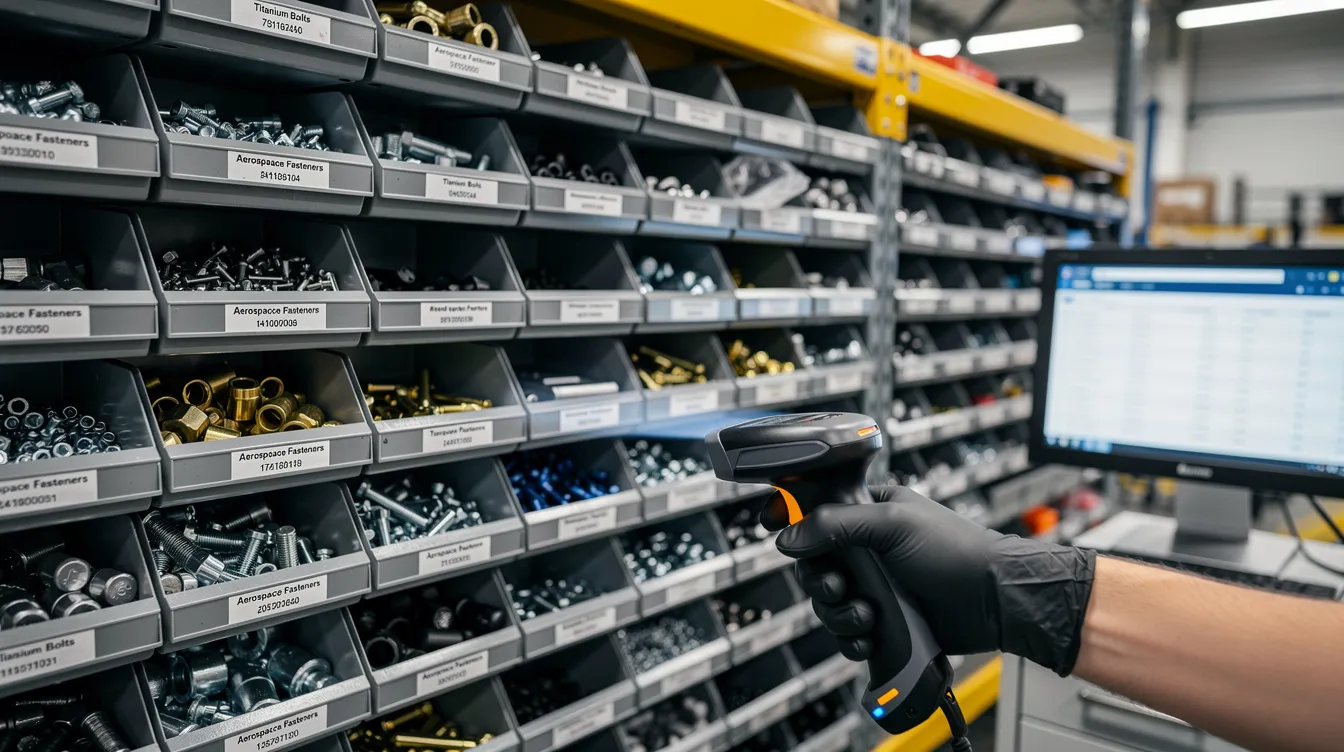
    The image depicts organized bins filled with small aerospace parts, each labeled for easy identification, alongside handheld scanning equipment designed for efficient inventory management. This setup enhances inventory accuracy and operational efficiency, crucial for aerospace companies in maintaining optimal inventory levels and regulatory compliance.

    Common Causes of Inaccuracy Revealed by Cycle Counts

    Once regular audits begin, patterns become visible. Teams often find:

    • Mis-labeled bins
    • Mixed lots in the same location
    • Operators picking from a different location than ERP shows
    • Phantom WIP that was scrapped months ago
    • Returns placed in generic catch-all locations
    • Confusing location naming across cells

    Small recurring discrepancies matter. If one cell is always short by one or two fasteners, the cause is probably a process leak, not random noise. The fix may be a clearer work instruction, better scanner placement, simpler returns, or improved clear communication between stores and production.

    Connect981 workflows can route discrepancies to supervisors, quality, supply chain, or maintenance with required actions. That prevents quiet stock adjustments that hide the real problem.

    WIP Visibility: Seeing Work and Material Where It Actually Lives

    Inventory accuracy is not limited to stockroom bins. In aerospace, inventory is often embedded in WIP: subassemblies, kits, partial tear-downs, removed parts, outside processing, supplier-held material, and equipment moving through long routings.

    Poor WIP visibility creates familiar problems. Planners cannot trust dates. Schedulers run hot orders. Quality teams search for parts. MRO turn-around-time slips. A 737 nacelle line, A320 cabin mod, or C-check hangar can look organized in a meeting and still have parts physically sitting in the wrong bay.

    Better WIP visibility requires clear rules:

    • Every work order has a current digital step, status, and location.
    • Every serialized component is tied to the work order where it is consumed, installed, removed, or held.
    • Operators move WIP in the system when they move it physically.
    • Holds, defects, and shortages are logged in real time, not at shift end.
    • Supplier and outside processing status is visible to the same planning view.

    Connect981 sits as a unified operations layer across ERP, MES, QMS, and supplier data. The goal is not to make operators re-key data into three systems. The goal is one usable management system that supports tracking, reporting, and execution where the work happens.

    With tablets or terminals at the cell, operators can record consumption, move WIP, log holds, and adjust status while the job is still in front of them.

    The image depicts an aircraft hangar bay bustling with maintenance crews working on various aircraft sections, surrounded by parts carts and tools, essential for ensuring operational efficiency and compliance with safety standards in the aerospace industry. The scene highlights the importance of inventory management systems in maintaining optimal inventory levels and enhancing the efficiency of maintenance operations.

    Core WIP Visibility Metrics that Indicate Inventory Accuracy is Improving

    Use a small set of practical KPIs:

    • Percentage of active work orders with current step and location.
    • Average time from physical move to system update.
    • Percentage of WIP items with confirmed serial and lot records.
    • Number of “unknown,” “offline,” or manually searched jobs.
    • Schedule adherence at constraint resources.

    These are ISO 22400-style measures in plain operating language. If queues stabilize, manual searches fall, and planners trust system views, WIP data is becoming reliable. Connect981 dashboards can show these metrics by line, shift, cell, or supplier so leaders see where behavior has changed.

    Traceability Controls as a Real-Time Inventory Control Mechanism

    Traceability is not paperwork for the auditor after the job is done. In aerospace, traceability is a control that prevents inventory errors, nonconformance, and quality escapes before they happen.

    Aerospace traceability includes serial and lot linkage, life-limited part status, configuration management, revision control, and FOD risk controls. AS9100 clause 8.5.2 requires suitable identification and traceability when needed, including control of unique identification and documented information. FAA rules also require life status control for life-limited parts, including serial or lot control where applicable.

    The operating rule is straightforward: no serial, no issue. If a critical component does not have the required serial, lot, condition, and release status captured, it should not move into the assembly or aircraft.

    Clean genealogy matters. Teams need to know which serials and lots were issued to which work order, installed on which tail number or shipset, removed during which MRO event, and dispositioned into repair, quarantine, scrap, or stock.

    Digital work instructions and electronic sign-offs help by recording operator, time, part, location, and inspection result during normal execution. Connect981 is designed around aerospace documentation and compliance, so traceability events become part of the process rather than after-the-fact reporting.

    Practical Traceability Practices that Support Inventory Accuracy

    Effective traceability depends on habits operators can actually follow:

    • Scan serials and lots into the work order at issue, install, removal, and return.
    • Do not issue from generic locations.
    • Log scrap with reason codes and required approvals.
    • Use kit-level barcodes tied to component lists.
    • Record kit seal and break events.
    • Return unused material through controlled workflows.
    • In MRO, log removed versus installed parts and cannibalization events.
    • Link repair tags to inventory and work history.

    These practices make inventory tracking more accurate and reduce investigation time after a deviation. Connect981 can enforce prompts, mandatory fields, and integrated checklists instead of relying on memory, tribal knowledge, or disconnected tracking systems.

    Inventory Accuracy KPIs that Matter for Aerospace Operations

    Most inventory management systems can produce long reports. Aerospace teams need fewer metrics that help run today’s shifts and improve tomorrow’s practices.

    Use 5 to 7 KPIs per area:

    • Inventory record accuracy: system quantity, location, status, serial, and lot match physical reality.
    • Location accuracy: the right part is in the right place.
    • Traceability completeness: required genealogy is present, with exception rate near zero.
    • WIP record completeness: active jobs have current step, location, and part associations.
    • Cycle count compliance: planned counts completed on time.
    • Transaction digital execution: issues, returns, scrap, holds, and moves captured at point-of-use.
    • Service metrics: critical stock-out incidents, schedule adherence, and perfect internal kit delivery.

    Shrinkage and adjustment rate still matter, but treat them as process signals, not just financial noise. Rising adjustments may point to poor receiving, weak returns, confusing storage, or inefficient handoffs.

    Good metrics also support efficient inventory management: optimal inventory levels, lower costs, fewer emergency purchases, better use of resources, and improved operational efficiency. They help companies make informed decisions about stock, demand, market trends, and supplier performance.

    Using KPIs for Continuous Improvement, Not Just Reporting

    KPIs should change daily behavior. They should not live only in monthly PowerPoint decks.

    A useful routine is simple. Review cycle count discrepancies, missing serials, WIP exceptions, and critical shortages in daily stand-ups. Assign owners by value stream or cell. Track whether countermeasures improve accuracy before and after the change.

    If one cell repeatedly mis-transacts returns, simplify the process or add a Connect981 workflow check. If one supplier causes repeated lot data gaps, fix the supplier collaboration process. If one cabinet keeps drifting, change the cabinet control.

    Make the data visible to operators. Cell-level screens and tablets help teams see how their actions enhance flow, reduce costs, avoid penalties, and protect customers.

    How Connect981 Supports Efficient, Compliant Inventory Management in Aerospace

    Connect981 supports inventory accuracy aerospace teams can use in real operations. It brings digital work instructions, serial number management, WIP tracking, quality checks, supplier coordination, and real time visibility into one connected layer.

    The platform bridges ERP, MES, QMS, PLM, and supplier portals so inventory transactions, holds, shortages, and exceptions do not depend on duplicate entry. Low-code workflows let operations teams codify cycle counts, discrepancy handling, traceability checks, and escalation practices without heavy IT projects.

    Connect981 also provides real-time reporting and AI-assisted insight to show where accuracy is drifting by line, shift, part family, or supplier. That helps leaders act before the issue becomes a late aircraft, a failed audit, or a missed customer commitment.

    Inventory accuracy improves when transactions happen where the work happens. Traceability becomes powerful when it prevents bad movement, not when it explains failure later. If your team wants practical inventory control built for aerospace and MRO, request a demo of Connect981.

    Inventory accuracy aerospace work is not about a neat warehouse report. It is about whether the part the system says is available is physically present, in the right location, with the right serial, lot, condition, revision, and release status.

    In an aerospace plant or MRO shop, a 2 to 3 percent inventory error can stop real operations. One missing life-limited component, one misplaced LRU, or one fastener lot with unclear status can delay flight schedules, extend turn-around-time, and damage customer satisfaction. Picture a 2025 A320 heavy check where a serialized actuator shows “available,” but the unit is actually in a shadow rack, on hold, or already cannibalized for another job.

    This article answers four practical questions: what causes poor inventory accuracy, how cycle counts help, how WIP visibility and traceability controls work together, and which KPIs show whether the system is improving.

    Connect981 approaches this as an aerospace operations platform, not generic retail inventory management software. The focus is line-side, stores, kits, and WIP inventory used in aerospace manufacturing and maintenance, not finished goods in a distribution center.

    An aerospace technician stands beside an aircraft maintenance bay, using a tablet to manage inventory records, while organized parts carts are neatly arranged nearby. This scene highlights the importance of efficient inventory management and accurate tracking systems in maintaining optimal inventory levels for aerospace companies.

    What Causes Poor Inventory Accuracy in Aerospace Environments?

    Poor inventory accuracy usually comes from small process leaks that compound over time. The challenges faced by aerospace companies are rarely one bad count. They are weak handoffs between people, systems, and physical flow.

    Common causes include:

    • Informal “borrow and replace later” habits, where components move without a transaction.
    • Undocumented kitting changes, especially when technicians adjust kits to keep work moving.
    • ERP, MES, spreadsheets, and paper pick tickets showing different inventory records.
    • Delayed backflush, late returns, miscoded scrap, and missing issue transactions.
    • Parts staged in aisles, warehouse space, tool cribs, line-side cabinets, or shadow racks without accurate tracking.
    • Missing serial or lot links to work orders, partial tear-downs, and unlogged cannibalization in MRO.
    • Point-of-use cabinets with stock levels that operators trust more than the system.

    Regulatory compliance raises the stakes. AS9100, FAA, and EASA expectations make traceability, documentation accuracy, safety standards, and configuration control essential. When physical reality and inventory records diverge, teams face audit findings, schedule risk, and potential quality escapes.

    The damage goes beyond accounting. Bad inventory accuracy undermines forecast demand, decision making, customer commitments, and maintaining optimal inventory levels. It also creates excess inventory, poor cash flow, higher holding costs, weaker financial performance, and more emergency buying during supply chain disruptions.

    Cycle Count Discipline: The Fastest Lever to Improve Inventory Accuracy

    Cycle counting is the practical alternative to relying on one annual physical inventory count. Instead of shutting down for a wall-to-wall count, teams perform focused physical counts on critical bins, kits, serialized parts, and WIP locations throughout the year.

    Start with risk:

    • High value serialized parts
    • Customer-furnished equipment
    • Long-lead items
    • Safety-critical hardware
    • Fast-moving line-side stock
    • Locations with repeated discrepancies

    A simple pattern works well: daily checks on critical line-side bins, weekly checks in kitting areas, and monthly deep dives on slow-moving spares. The point is not just counting. The point is using inventory control to find where processes are drifting.

    The basic formula is simple: accurate records divided by records counted. In aerospace, targets should be strict. Aim for more than 99 percent accuracy on serialized, life-limited, and safety-critical parts, and more than 97 percent overall.

    A TriVista case study reported an aerospace and defense facility improving from 10 to 20 percent inventory accuracy after audits to about 97 percent across roughly 8,500 SKUs, using barcoding, standard procedures, and layout improvements. That kind of gain comes from disciplined practices, not spreadsheet cleanup alone.

    Connect981 can surface cycle-count tasks automatically based on value, movement, defect history, and prior discrepancies. It can also record variance at the bin and serial level, giving supervisors real time data they can act on.

    The image depicts organized bins filled with small aerospace parts, each labeled for easy identification, alongside handheld scanning equipment designed for efficient inventory management. This setup enhances inventory accuracy and operational efficiency, crucial for aerospace companies in maintaining optimal inventory levels and regulatory compliance.

    Common Causes of Inaccuracy Revealed by Cycle Counts

    Once regular audits begin, patterns become visible. Teams often find:

    • Mis-labeled bins
    • Mixed lots in the same location
    • Operators picking from a different location than ERP shows
    • Phantom WIP that was scrapped months ago
    • Returns placed in generic catch-all locations
    • Confusing location naming across cells

    Small recurring discrepancies matter. If one cell is always short by one or two fasteners, the cause is probably a process leak, not random noise. The fix may be a clearer work instruction, better scanner placement, simpler returns, or improved clear communication between stores and production.

    Connect981 workflows can route discrepancies to supervisors, quality, supply chain, or maintenance with required actions. That prevents quiet stock adjustments that hide the real problem.

    WIP Visibility: Seeing Work and Material Where It Actually Lives

    Inventory accuracy is not limited to stockroom bins. In aerospace, inventory is often embedded in WIP: subassemblies, kits, partial tear-downs, removed parts, outside processing, supplier-held material, and equipment moving through long routings.

    Poor WIP visibility creates familiar problems. Planners cannot trust dates. Schedulers run hot orders. Quality teams search for parts. MRO turn-around-time slips. A 737 nacelle line, A320 cabin mod, or C-check hangar can look organized in a meeting and still have parts physically sitting in the wrong bay.

    Better WIP visibility requires clear rules:

    • Every work order has a current digital step, status, and location.
    • Every serialized component is tied to the work order where it is consumed, installed, removed, or held.
    • Operators move WIP in the system when they move it physically.
    • Holds, defects, and shortages are logged in real time, not at shift end.
    • Supplier and outside processing status is visible to the same planning view.

    Connect981 sits as a unified operations layer across ERP, MES, QMS, and supplier data. The goal is not to make operators re-key data into three systems. The goal is one usable management system that supports tracking, reporting, and execution where the work happens.

    With tablets or terminals at the cell, operators can record consumption, move WIP, log holds, and adjust status while the job is still in front of them.

    The image depicts an aircraft hangar bay bustling with maintenance crews working on various aircraft sections, surrounded by parts carts and tools, essential for ensuring operational efficiency and compliance with safety standards in the aerospace industry. The scene highlights the importance of inventory management systems in maintaining optimal inventory levels and enhancing the efficiency of maintenance operations.

    Core WIP Visibility Metrics that Indicate Inventory Accuracy is Improving

    Use a small set of practical KPIs:

    • Percentage of active work orders with current step and location.
    • Average time from physical move to system update.
    • Percentage of WIP items with confirmed serial and lot records.
    • Number of “unknown,” “offline,” or manually searched jobs.
    • Schedule adherence at constraint resources.

    These are ISO 22400-style measures in plain operating language. If queues stabilize, manual searches fall, and planners trust system views, WIP data is becoming reliable. Connect981 dashboards can show these metrics by line, shift, cell, or supplier so leaders see where behavior has changed.

    Traceability Controls as a Real-Time Inventory Control Mechanism

    Traceability is not paperwork for the auditor after the job is done. In aerospace, traceability is a control that prevents inventory errors, nonconformance, and quality escapes before they happen.

    Aerospace traceability includes serial and lot linkage, life-limited part status, configuration management, revision control, and FOD risk controls. AS9100 clause 8.5.2 requires suitable identification and traceability when needed, including control of unique identification and documented information. FAA rules also require life status control for life-limited parts, including serial or lot control where applicable.

    The operating rule is straightforward: no serial, no issue. If a critical component does not have the required serial, lot, condition, and release status captured, it should not move into the assembly or aircraft.

    Clean genealogy matters. Teams need to know which serials and lots were issued to which work order, installed on which tail number or shipset, removed during which MRO event, and dispositioned into repair, quarantine, scrap, or stock.

    Digital work instructions and electronic sign-offs help by recording operator, time, part, location, and inspection result during normal execution. Connect981 is designed around aerospace documentation and compliance, so traceability events become part of the process rather than after-the-fact reporting.

    Practical Traceability Practices that Support Inventory Accuracy

    Effective traceability depends on habits operators can actually follow:

    • Scan serials and lots into the work order at issue, install, removal, and return.
    • Do not issue from generic locations.
    • Log scrap with reason codes and required approvals.
    • Use kit-level barcodes tied to component lists.
    • Record kit seal and break events.
    • Return unused material through controlled workflows.
    • In MRO, log removed versus installed parts and cannibalization events.
    • Link repair tags to inventory and work history.

    These practices make inventory tracking more accurate and reduce investigation time after a deviation. Connect981 can enforce prompts, mandatory fields, and integrated checklists instead of relying on memory, tribal knowledge, or disconnected tracking systems.

    Inventory Accuracy KPIs that Matter for Aerospace Operations

    Most inventory management systems can produce long reports. Aerospace teams need fewer metrics that help run today’s shifts and improve tomorrow’s practices.

    Use 5 to 7 KPIs per area:

    • Inventory record accuracy: system quantity, location, status, serial, and lot match physical reality.
    • Location accuracy: the right part is in the right place.
    • Traceability completeness: required genealogy is present, with exception rate near zero.
    • WIP record completeness: active jobs have current step, location, and part associations.
    • Cycle count compliance: planned counts completed on time.
    • Transaction digital execution: issues, returns, scrap, holds, and moves captured at point-of-use.
    • Service metrics: critical stock-out incidents, schedule adherence, and perfect internal kit delivery.

    Shrinkage and adjustment rate still matter, but treat them as process signals, not just financial noise. Rising adjustments may point to poor receiving, weak returns, confusing storage, or inefficient handoffs.

    Good metrics also support efficient inventory management: optimal inventory levels, lower costs, fewer emergency purchases, better use of resources, and improved operational efficiency. They help companies make informed decisions about stock, demand, market trends, and supplier performance.

    Using KPIs for Continuous Improvement, Not Just Reporting

    KPIs should change daily behavior. They should not live only in monthly PowerPoint decks.

    A useful routine is simple. Review cycle count discrepancies, missing serials, WIP exceptions, and critical shortages in daily stand-ups. Assign owners by value stream or cell. Track whether countermeasures improve accuracy before and after the change.

    If one cell repeatedly mis-transacts returns, simplify the process or add a Connect981 workflow check. If one supplier causes repeated lot data gaps, fix the supplier collaboration process. If one cabinet keeps drifting, change the cabinet control.

    Make the data visible to operators. Cell-level screens and tablets help teams see how their actions enhance flow, reduce costs, avoid penalties, and protect customers.

    How Connect981 Supports Efficient, Compliant Inventory Management in Aerospace

    Connect981 supports inventory accuracy aerospace teams can use in real operations. It brings digital work instructions, serial number management, WIP tracking, quality checks, supplier coordination, and real time visibility into one connected layer.

    The platform bridges ERP, MES, QMS, PLM, and supplier portals so inventory transactions, holds, shortages, and exceptions do not depend on duplicate entry. Low-code workflows let operations teams codify cycle counts, discrepancy handling, traceability checks, and escalation practices without heavy IT projects.

    Connect981 also provides real-time reporting and AI-assisted insight to show where accuracy is drifting by line, shift, part family, or supplier. That helps leaders act before the issue becomes a late aircraft, a failed audit, or a missed customer commitment.

    Inventory accuracy improves when transactions happen where the work happens. Traceability becomes powerful when it prevents bad movement, not when it explains failure later. If your team wants practical inventory control built for aerospace and MRO, request a demo of Connect981.

  • Andon System Manufacturing: From Cords and Lights to Digital Escalation Workflows

    Andon System Manufacturing: From Cords and Lights to Digital Escalation Workflows

    Key Takeaways

    • An andon system is a structured escalation process, not just a light, board, or andon cord.
    • Andon in lean manufacturing still matters because it creates faster response, fewer defects, less downtime, and better visibility.
    • Modern digital andon systems connect alerts to corrective actions, root cause analysis, dashboards, and continuous improvement.
    • Connect 981 supports andon-style workflows inside a broader aerospace and MRO operations platform, not as a standalone andon light system.

    Introduction: Why Andon System Manufacturing Still Matters in 2026

    In 2026, many production problems still start small. A machinist sees a dimension drifting on an aerospace component. An electronics operator detects a missing connector before test. An MRO technician opens an engine module and finds the routing sheet does not match the installed configuration. If the issue is not surfaced quickly, hours of rework, scrap, schedule disruption, and audit exposure follow.

    Unplanned downtime commonly consumes 5 to 20 percent of productive capacity in manufacturing, according to Monitory.ai research on downtime cost. In regulated industries like aerospace, the cost is not only lost production time. A single escaped defect can trigger NCRs, MRB review, customer notification, and late delivery penalties.

    That is why andon system manufacturing remains relevant in high-mix, high-variance environments such as aerospace structures, avionics, precision machining, and MRO. This article treats the andon system as a structured escalation mechanism: signal, ownership, response, resolution, and learning.

    Traditional Andon systems typically rely on physical components such as pull cords, lights, and manual boards to signal issues, while digital Andon systems integrate with software and IoT technologies for real-time monitoring and alerts. The best implementations connect MES, ERP, quality records, supplier workflows, and continuous improvement efforts.

    A factory operator is using a tablet beside an aircraft assembly fixture, actively engaging in the production process while utilizing a digital andon system for quality control and operational excellence. The setup highlights the integration of modern andon systems in lean manufacturing, enhancing problem detection and rapid response capabilities on the production floor.

    What Is an Andon System in Manufacturing?

    An andon system is a visual and audible alert and escalation mechanism that surfaces abnormalities in real time. The japanese word “andon” originally referred to a lantern, which is why the concept became closely associated with visual management.

    Its roots are in lean manufacturing and the toyota production system, especially jidoka: build in quality and stop to fix when an abnormality occurs. In Toyota’s production system, the Andon cord allows any assembly employee to pause production when quality issues arise, ensuring defects do not propagate down the line.

    A good andon process replaces shouting, radios, sticky notes, and tribal knowledge with standardized andon signals. Operators, line workers, team leader roles, maintenance technicians, quality engineers, logistics, safety, engineering, and production control all know what happens next.

    The andon system works through a simple flow: problem detection, andon alert, owner assignment, corrective actions, closure, and data logging. The primary benefits of an Andon system include reduced downtime, empowered workers, higher quality control, and data-driven process improvements.

    How an Andon System Works on the Shop Floor

    An Andon system operates through a precise process flow designed for rapid response, allowing operators to signal issues immediately when they occur. Andon systems enable immediate problem detection, allowing workers to quickly identify and report issues without leaving their workstations, which results in reduced downtime and improved productivity.

    A trigger may be an andon cord pull, push button, HMI soft button, barcode scan, QR scan, automatic andon from sensors or PLCs, or software-triggered digital alerts. In a mature system, the andon alert includes location, issue type, severity, timing, product, and work order.

    In the first five minutes, the team acknowledges the alert notification, triages at the station, decides whether to stop production, and applies containment or a temporary countermeasure. If the line stops, restart criteria should be explicit. Every event should be timestamped, categorized, and tied to a job, serial, or work order.

    Core Components: Cords, Lights, Boards, and Digital Andon

    The classic Andon system consists of three primary components: the Andon cord, Andon light, and Andon board, which work together to signal issues on the production floor. Andon systems typically consist of three primary components: an Andon cord, an Andon light, and an Andon board, which work together to alert team members about production issues.

    Traditional Andon Cords and Fixed-Position Stop

    Traditional andon on final assembly lines often used an overhead andon board and overhead pull cord. The Andon cord is typically located overhead on the assembly line and can be pulled by operators to signal that assistance is needed due to a problem identified in the production process.

    When an operator pulls the cord on a manufacturing line, a timed response window starts. If the issue is not resolved, the product stops at a predefined station. In a fuselage section, for example, mis-torqued fasteners must be corrected before the body moves to the next dock. This balances flow protection with product quality protection.

    Andon Lights, Buzzers, and Local Signals

    Stack lights, buzzers, audio alerts, and visual cues provide immediate local feedback. Andon lights use a color-coded system to indicate the status of production: green for normal operation, yellow for a minor issue that needs attention, and red for a stop condition requiring immediate investigation.

    The Andon light system uses color coding to indicate different statuses: green for normal operation, yellow for minor issues needing attention, and red for serious problems requiring immediate action. Color-coded lights and auditory tones are typically used in Andon systems to denote production status and operational bottlenecks.

    Local signals are useful, but support teams may miss them in large plants, noisy areas, or dense layouts. A light alone does not prove who responded, when they arrived, or whether the root cause was removed.

    Andon Boards and Plant-Wide Visibility

    Andon boards serve as centralized visual control centers that display the status of production lines, allowing supervisors and team members to quickly assess operational conditions and respond accordingly. Andon boards serve as centralized visual control centers that display the status of production lines, allowing supervisors and team members to monitor operations at a glance.

    Traditional andon boards used physical lights, tags, or scoreboards. Digital boards now show line status, downtime reasons, response timers, production targets, production metrics, and open escalation paths across the plant floor.

    From Physical Andon to Digital Andon Systems

    A digital andon system combines physical signals with andon software, mobile notifications, IIoT sensors, and role-based workflows. Digital Andon systems enhance the traditional approach by providing automated alerts, real-time data integration, and customizable dashboards, which allow for faster response times and better tracking of production issues.

    In modern Andon systems, digital boards can integrate with factory systems to provide real-time data visualization, showing key performance indicators and alerts for immediate action. Digital Andon systems enhance traditional setups by integrating with other manufacturing software, providing real-time data visualization and automated alerts to improve response times.

    Why Andon Matters in Lean Manufacturing and Aerospace Operations

    Andon systems are integral to Lean manufacturing as they provide immediate visual alerts to operators and management about production issues, enabling quick responses to prevent defects from propagating down the line. As a lean tool, andon supports flow, respect for people, quality assurance, and the lean principle of stopping to fix.

    The implementation of Andon systems supports the Lean principle of continuous improvement (Kaizen) by allowing workers to identify and address problems as they occur, thus reducing waste and enhancing product quality. Andon systems support continuous improvement (Kaizen) by helping identify frequent stumbling blocks in the production process, which can lead to targeted improvements.

    Andon systems help minimize defects by catching errors at the source, saving time, reducing material waste, and lowering rework costs. By addressing issues as they occur, Andon systems help ensure that resources are used efficiently and only high-quality products continue through the production line, leading to scrap reduction.

    Andon systems empower employees by allowing them to stop production when they detect a quality issue, fostering a culture of accountability and teamwork focused on quality and efficiency. Implementing Andon systems empowers employees by allowing them to stop the production line if they detect a quality issue, promoting a culture of quality and accountability.

    For aerospace and MRO, this matters because traceability, AS9100, FAA, EASA, ITAR, configuration control, and quality standards create a higher cost of late detection. Andon systems provide real-time visibility into the manufacturing process, enabling teams to identify and resolve floor abnormalities before they escalate.

    Traditional Andon vs. Digital Andon: What’s Really Different?

    Most plants do not choose between physical and digital. They blend both. The real shift is from “signal only” to “signal plus response management and learning.”

    Traditional Andon: Fast Signal, Limited Follow-Through

    While traditional Andon systems provide immediate visual signals, they often lack the ability to track response times and issue resolution, whereas digital Andon systems can log incidents, assign tasks, and escalate alerts automatically.

    A torque wrench failure may trigger an andon signal. Maintenance arrives late, the tool is swapped, and production resumes. If duration, cause, and corrective actions are not recorded, the same issue repeats across shifts.

    Digital Andon: From Alert to Resolution Management

    Digital systems convert an alert into a structured event with line, station, product, shift, category, severity, and timestamps. Digitally driven Andon systems can track downtime patterns and recurring issues, providing actionable data for long-term process optimization.

    Modern Andon systems log the frequency and duration of stops to help managers track long-term bottlenecks. If no one acknowledges an alert within the defined time, escalation moves to supervisors, value stream managers, or plant leadership.

    Hybrid Approaches: Lights on the Line, Software in the Background

    A strong hybrid approach keeps the operator interface simple. A button press at a CNC cell can change stack lights, log the event, and notify maintenance through mobile notifications. This preserves quick response while adding traceability, accountability, and data for reducing waste.

    What Problems Does an Andon System Signal? Practical Shopfloor Examples

    Andon alerts should focus on problems that affect flow, safety, quality, delivery, or compliance. Common categories include machine downtime, quality issues, material shortage, supplier part issue, tooling, calibration, documentation, safety concern, and production bottleneck.

    Machine Downtime and Equipment Failures

    A CNC spindle alarm, hydraulic leak, or oven temperature deviation should trigger an andon alert. Maintenance technicians receive the alert, line status changes, and the timer starts. Capture machine ID, fault code, duration, spare parts used, root cause, and corrective actions.

    Quality Defects and Escaped Issues

    A dimensional nonconformance or wiring error should route to quality engineers. The area may contain suspect product, pause the station, or stop production if the defect could move downstream. Link the event to NCR, MRB, 8D, lot, and serial records.

    Material Shortages and Supplier Part Issues

    If a kitting area lacks a bracket or a supplier seal fails incoming inspection, the alert should go to materials, procurement, and planning. Capture part number, supplier, required quantity, PO, work order, and schedule impact.

    Tooling, Fixtures, and Calibration Problems

    A worn cutting tool, fixture misalignment, or expired gauge can create quiet quality drift. The andon system gives operators permission to call for help before bad parts accumulate. Tracking these events improves tool change intervals, poka-yoke, and standard work.

    Documentation, Work Instructions, and Missing Information

    Outdated drawings, unclear digital work instructions, or missing customer addenda are legitimate andon events. Operators should not build to guesswork. Digital andon connects the issue to the exact work order, revision, operation, and owner.

    Safety Concerns and Near Misses

    Coolant on a walkway, missing guarding, or incorrect PPE should trigger stricter rules. Safety alerts often require immediate stop, EHS involvement, photos, contributing factors, and preventive action.

    Production Bottlenecks and Operator Assistance

    Not every alert means the line stops. Assistance calls help team leaders rebalance labor, support training, and identify unstable work. Separate assistance KPIs from hard stops so line workers keep raising issues when problems arise.

    Issue Categories, Response Rules, and Accountability

    Categorization turns lights and noise into a management system. Plants should define stable categories such as quality, machine, material, safety, documentation, methods, and staffing.

    Each category needs a default owner, response expectation, and restart rule. Quality may require containment. Machine faults may require lockout or maintenance triage. Supplier problems may require buyer escalation. Digital systems can enforce role-based ownership so issues arise, move, and close with named accountability.

    Andon as a Continuous Improvement Engine, Not Just an Alarm

    The value of andon is not only faster firefighting. It is the learning loop. Frequency, duration, category, root cause, area, and shift data feed Pareto charts, A3 reviews, kaizen events, and continuous improvement priorities.

    Andon systems foster better communication between workers and management, ensuring that alerts can be acted upon swiftly, which enhances overall operational efficiency. Weekly reviews can expose chronic supplier shortages, repeated sensor failures, unclear work instructions, and gaps in robust processes.

    Common Andon Implementation Mistakes (and How to Avoid Them)

    Many plants install lights and cords but never achieve operational excellence because the process is weak. Common mistakes include treating andon as hardware only, unclear rules, slow response, blame culture, excessive categories, and poor data capture.

    3M and Caterpillar utilize button-based Andon systems where operators can signal issues, prompting immediate attention from team leaders to resolve problems quickly. Amazon employs a “Virtual Andon Cord” in its customer service operations, allowing representatives to trigger alerts for significant product issues, potentially halting shipments until the root cause is addressed. In healthcare, Andon principles are applied to improve patient safety, such as using lights on Code Blue carts to signal daily checks and alarms on infusion pumps to alert staff about potential issues.

    Slow Response Times and Missing Escalation

    If no one responds, operators stop using the system. Define expectations, such as two to three minutes for acknowledgement and a severity-based target for first action. Use andon boards or dashboards to show open alerts and timers.

    Unclear Ownership and Fragmented Follow-Up

    “Maintenance will handle it” is not ownership. Assign a role or named owner for each alert, require handoffs, and prevent closure without verified corrective actions.

    Weak Data Capture and Inconsistent Classification

    Paper logs and retrospective spreadsheets are late, incomplete, and hard to analyze. Use simple digital forms with picklists, photos, cause codes, and periodic data quality audits.

    Designing an Andon Workflow: Practical Checklist

    Use this checklist when implementing andon or upgrading a lean manufacturing system.

    Checklist Items: From Trigger to Trend Review

    • Who can trigger an andon alert? Operators, inspectors, maintenance, team leaders, and any person for safety or quality concerns.
    • How is the alert triggered? Andon cord, push button, stack light, tablet, HMI, QR code, sensor, PLC, or automatic andon.
    • What happens immediately? Acknowledge, triage, contain, decide whether the line stops, and communicate status.
    • Who owns the response? Assign default owners by category and escalation paths when the issue is not resolved.
    • What data is captured? Station, machine, product, batch, serial, shift, severity, timestamps, photos, root cause, and action.
    • How is the issue closed? Require verification, documented corrective actions, and restart approval when needed.
    • How are trends reviewed? Use weekly or monthly reviews of dashboards, production metrics, repeat issues, and top loss drivers.
    • How should rollout begin? Pilot one line or cell, refine with operators, then scale across the plant.

    A maintenance technician is inspecting a machine tool on the production floor, with a nearby signal light indicating the status of the andon system. This visual management tool helps alert operators to any quality control issues or abnormalities that may arise during the production process.

    Digital Andon Systems and Workflow-Based Escalation

    Modern andon systems increasingly sit inside broader digital operations platforms. The digital andon system integrates with MES, ERP, CMMS, QMS, PLM, and supplier systems to create a unified view of production, quality, and maintenance.

    In a high-tech electronics assembly line, an automatic Andon system uses sensors to detect assembly errors and equipment malfunctions, triggering visual alerts on digital dashboards and notifications to maintenance teams. This is where digital tools matter: alerts become tasks, approvals, and records instead of isolated messages.

    Andon Software Capabilities to Look For

    Look for configurable alert types, routing rules, multi-channel notifications, timed escalation, structured forms, photo uploads, links to work orders, links to defect records, audit logs, digital boards, OEE dashboards, and APIs. Configurability is critical because new products, regulations, and routings change faster than traditional IT projects.

    How Connect 981 Supports Andon-Style Escalation in Aerospace and MRO

    Connect 981 is a unified aerospace operations platform that can support andon-style escalation as part of broader production, quality, supplier, and MRO workflows. It is not an andon light system. It is an operations layer that connects alerts with work instructions, traceability, defects, supplier collaboration, and compliance records.

    From Andon Alert to Structured Workflow

    An operator or inspector can raise an alert from a tablet form tied to a work step. Connect 981 can route the event to quality, maintenance, methods, supply chain, or program teams based on line, category, customer, or severity. Status changes such as raised, acknowledged, blocked, resolved, and verified are timestamped.

    Connecting Andon to Work Instructions, Quality, and Traceability

    Connect 981 links events to digital work instructions, drawing revisions, inspection plans, serial numbers, lot numbers, and configuration records. This prevents a common failure mode: the alert lives in one system while the quality record, maintenance action, and supplier response live elsewhere.

    Cross-Factory and Supplier Visibility

    Aerospace primes and tier suppliers often need shared visibility when a supplier issue threatens schedule or conformity. Connect 981 can support cross-factory comparison of alert frequency, response times, issue types, and supplier nonconformance patterns.

    A group of aerospace technicians is gathered on a clean shop floor, closely reviewing a critical component as part of their quality control process. The environment reflects lean manufacturing principles, emphasizing operational excellence and continuous improvement efforts in their production line.

    Why Zero/Low-Code Matters for Andon Workflows

    Aerospace and MRO operations change frequently. New programs, customer requirements, inspection steps, and supplier rules require adaptable workflows. Connect 981’s zero and low-code workflow builder helps operations and CI teams adjust categories, forms, routing, and escalation without long custom development cycles.

    Conclusion: Build an Andon System That Turns Problems Into Progress

    An effective andon system is a structured escalation process that spans signal, alert, response, verification, and learning. Traditional cords, stack lights, and boards still have value, but they deliver more when connected to workflows, data capture, and accountability.

    The practical question is direct: are problems visible, are responses reliable, and does event data drive improvement? If not, the system is signaling, but it is not yet learning.

    Request a demo to see how Connect 981 turns shopfloor issues into structured workflows, traceable actions, and production visibility across aerospace manufacturing and MRO.

    FAQ

    How big should we start when implementing or upgrading an Andon system?

    Start with one production line, cell, or value stream. Use three to five categories, simple response rules, and a 60 to 90 day pilot. Include operators, maintenance, quality, and team leaders from day one.

    Do we need new hardware to move to a digital Andon system?

    Not always. Existing stack lights, buttons, PLC inputs, and HMIs can often connect through gateways or APIs. In many cases, the bigger change is process discipline, not hardware replacement.

    How do we prevent operators from overusing the Andon system and slowing production?

    Define severity levels and clear examples. A safety concern, quality risk, sustained equipment issue, or missing critical information should be raised early. Minor help calls should be tracked separately from hard stops.

    How does an Andon system fit with our existing MES or ERP?

    Andon complements MES and ERP by handling real-time exceptions around the execution data those systems manage. Platforms like Connect 981 can sit above existing systems as a unified operations layer.

    What metrics should we use to measure Andon system effectiveness?

    Track alerts by category, average response time, average resolution time, repeat issue rate, downtime minutes, scrap, rework, and production impact. Review these metrics in tiered meetings and CI reviews, not only on dashboards.

  • Manufacturing Data Historian: From Time‑Series Storage to Connected Aerospace Operations

    Manufacturing Data Historian: From Time‑Series Storage to Connected Aerospace Operations

    Most aerospace factories do not lack data. They lack a reliable way to connect machine evidence to work orders, serial numbers, quality decisions, supplier records, and audit history.

    A manufacturing data historian solves the first part of that problem: capturing what happened in the plant, when it happened, and under what process conditions. The larger operational challenge is making that historian data usable by the teams making daily production, maintenance, and compliance decisions.

    Answering the Core Question: What Is a Manufacturing Data Historian?

    A manufacturing data historian is specialized software for capturing, storing, and retrieving timestamped time series data from industrial equipment, PLCs, sensors, test stands, process controls, and industrial control systems. Data historian software is specifically designed to capture, store, and manage vast quantities of time-series data generated by industrial processes, providing real-time visibility into operations and a centralized repository for operational data.

    Historians emerged in the late 1980s and early 1990s to manage continuous data generated by SCADA, PLCs, and distributed control systems in chemicals, oil and gas, power, and process manufacturing. In aerospace, historian software often sits behind autoclaves, ovens, CNCs, shot peen machines, plating lines, environmental chambers, and engine test cells.

    The key purposes are real time visibility, historical data review, traceability, predictive maintenance, and quality analysis. Data historians enable real-time monitoring and historical trend analysis, which are essential for optimizing industrial processes and ensuring compliance with regulatory standards. The historian is necessary, but not sufficient. Its value rises when connected to work orders, quality checks, supplier collaboration, and compliance workflows.

    How Manufacturing Data Historians Work Day to Day

    Data historians allow continuous data collection from diverse factory equipment. They collect data from PLCs, CNC controllers, SCADA systems, DCS, IoT gateways, and condition monitoring systems using OPC UA, Modbus TCP, EtherNet/IP, ProfiNet, and vendor drivers.

    Each tag represents data points such as spindle speed, torque, temperature, pressure, flow, vibration, current draw, line speed, alarms, or analog data. Sampling may occur every few milliseconds, every second, or every few minutes. This high speed data collection gives process engineers reliable data for data analysis, troubleshooting, and process optimization.

    Timestamps matter. Data historians allow engineers to replay past events millisecond by millisecond to diagnose machine failures. That precision helps isolate the exact root cause of quality defects, especially when a defect depends on the sequence of pressure, temperature, tool motion, or operator action.

    Historians use data compression and interpolation to store time series data efficiently, balancing high resolution data, long term data storage, and cost. Recent plant data may stay at full resolution; older plant operating data may be rolled up to min, average, and max values while preserving data integrity.

    In composite production, an autoclave may write temperature, vacuum, and pressure curves every second for each batch and part serial number. Those process variables become part of the evidence package for production quality and maintaining compliance.

    A technician is examining aerospace manufacturing equipment on a factory floor, utilizing data historian software to collect and analyze operational data. This process allows for the continuous monitoring of equipment performance, helping to optimize operations and reduce downtime and maintenance costs.

    Data Historians vs Time‑Series Databases, SCADA, MES, ERP, and Data Lakes

    Data historian software is OT-centric data management software. It is built for stable ingestion, deterministic retrieval, data exchange with control systems, efficient storage, and data integrity in industrial settings. Unlike traditional databases and relational databases, data historians are optimized for high-speed data ingestion and retrieval, making them essential for predictive maintenance, historical trend analysis, and process optimization.

    Generic time-series databases often prioritize scale, developer APIs, and flexible queries across IoT, finance, or web metrics. They may not include native PLC, SCADA, or industrial control systems connectivity.

    SCADA provides operator screens, alarms, and real time data for control. The historian is usually the long-term memory behind SCADA.

    MES manages routing, execution, WIP, and electronic records. ERP, or enterprise resource planning, manages orders, inventory, finance, and resource allocation. Data historians integrate with manufacturing execution systems, enterprise resource planning software, and industrial control systems to centralize operational data, improve visibility, and facilitate data-driven decision-making. Data lakes aggregate historian exports, ERP, MES, QMS, supplier feeds, documents, and logs for advanced analytics tools used by data scientists and corporate users.

    In practice, the historian is one node in the architecture. Value comes from how historian data feeds MES, advanced analytics, and operational platforms such as Connect 981.

    What Types of Data Do Manufacturing Data Historians Capture?

    Data generated by historians typically includes:

    • Process data: temperature, pressure, flow, vacuum, humidity, cure profiles, paint booth conditions, and heat treat curves.
    • Machine performance: run, idle, fault states, cycle time, part counts, OEE signals, and production output.
    • Quality signals: torque curves, weld current, voltage, leak test results, vibration signatures, and test stand outputs.
    • Energy consumption: electricity, compressed air, gas, chilled water, and utilities by cell or program.
    • Event data: trips, interlocks, safety triggers, setpoint changes, operator actions, and alarms.
    • Facility conditions: cleanroom differentials, particle counts, storage temperature, humidity, and MRO bay conditions.

    The data collected by historians includes critical operational metrics such as temperature, pressure, and flow rates, which are timestamped for precise historical context, allowing for deep operational insights. Historians capture what happened and when. They usually need integration to show for which work order, serial number, repair order, or supplier lot.

    Why Data Historians Matter in Aerospace and Complex Manufacturing

    Aerospace operations depend on traceability, costly assets, and short response times. Data historians provide critical plant performance data for visualization and analytics tools, allowing manufacturers to spot bottlenecks and reduce waste.

    They continuously monitor key parameters such as machine performance, energy consumption, and production output, allowing manufacturers to fine-tune operations and detect inefficiencies before they escalate. By leveraging data historian software, manufacturers gain deeper visibility into their processes, helping them to optimize performance and drive continuous improvement.

    Data historians preserve years of historical records required for strict regulatory and safety compliance. Historians provide immutable, long-term data trails that allow manufacturers in highly regulated industries to prove compliance and achieve end-to-end product traceability. Standards such as EN 9130:2020 reinforce the need for retrievable aerospace records.

    For maintenance, data historians support predictive maintenance by continuously analyzing equipment performance and identifying early warning signs of potential failures, which helps in scheduling maintenance proactively and preventing costly unplanned outages. Predictive maintenance strategies enabled by data historians can lead to significant reductions in maintenance costs by replacing reactive repairs with planned interventions based on data-driven insights.

    From Raw Signals to Context: Events, Batch Records, and Operational Meaning

    Raw data is not enough. Event frames, batches, or unit procedures transform raw data and sequential measurements into production runs, test sequences, cure cycles, or repair events.

    Data historians create complete genealogy records for every batch to simplify compliance with automated audit trails when historian events are linked to material lots, serial numbers, operator IDs, tooling, program revision, and inspection records. A practical aerospace example is linking an autoclave cure curve to a composite panel serial number and its AS9102 first article inspection record.

    Historian vendors often provide event tools, but full operational process data usually requires MES, PLM, ERP, QMS, or workflow integration.

    Data Integrity, Advanced Data Storage, and Long‑Term Retention

    Data integrity and advanced data storage matter because aerospace audits often ask for proof long after the work was performed. A customer may request a 10-year-old pressure curve and expect it within minutes, complete and unaltered.

    Key features include checksums, write-once history blocks, redundant collectors, store-and-forward buffering, clock synchronization, restricted write access, strong authentication, and tamper-evident archives. Advanced data storage may use hot solid-state storage, warm disks, cold cloud object storage, archiving rules, and compression policies.

    Remote test stands may backfill late data after a network outage. Good historians preserve original timestamps and reconcile the upload without corrupting performance trends.

    Dashboards, Analytics, and Predictive Maintenance Built on Historian Data

    Historians are a primary source for dashboards, key performance indicators, downtime paretos, SPC charts, energy graphs, and condition monitoring panels. Engineers often retrieve data into BI tools, Excel, or notebooks to identify trends.

    Predictive maintenance models use equipment performance history to detect early warning signs of potential equipment failures. Teams can schedule maintenance proactively, reduce downtime and maintenance costs, extend asset life, and validate repairs.

    By leveraging historical data trends, manufacturers can adjust production schedules and maintenance plans to reduce energy usage and minimize waste, ultimately enhancing operational efficiency. The constraint is that insight often stays in dashboards unless it is pushed back into daily work.

    An engineer is inspecting a large industrial machine using diagnostic equipment to collect data on its performance, aiming to optimize operations and identify potential equipment failures. This process involves analyzing operational data and historical data to ensure efficient and reliable industrial operations.

    The Hidden Problem: Data Silos Around the Historian

    Data historians help prevent data silos by providing a centralized repository for operational data, enabling effective management and utilization across different departments. They also eliminate manual, error-prone paper logs by unifying siloed data from different machine brands.

    Still, many aerospace plants have multiple sites, multiple historians, OEM mini-historians, spreadsheets, ERP records, supplier certificates, QMS records, and maintenance files. Data silos return when historian data is separated from routing, nonconformance, inspection, and supplier evidence.

    The result is familiar: engineers export CSVs, compare timestamps manually, search screenshots, and reconstruct a story days after a defect. That weakens data driven decision making and slows informed decisions.

    Where Connect 981 Fits: Turning Historian Data into Operational Workflows

    Connect 981 is not a data historian, SCADA replacement, or time-series database. It is a unified operational layer for aerospace manufacturing and MRO that uses historian data inside work instructions, work orders, quality checks, supplier coordination, and audit-ready records.

    In a typical architecture, the historian continues to collect high-resolution industrial data. Connect 981 connects that historian data to ERP, MES, PLM, QMS, supplier systems, and shopfloor execution.

    If furnace tags show repeated temperature drift, Connect 981 can trigger a maintenance task, hold affected work orders, require additional inspection, and capture the decision trail. A test cell speed and torque curve can appear inside a digital work order or nonconformance record, so quality teams see context rather than separate tools.

    Connect 981 also supports AI-assisted root cause analysis, combining historian trends with defect logs, supplier lots, routing changes, and shift data.

    Connecting Historians with Work Orders, Quality, and Traceability

    In production execution, historian tags tied to operations let supervisors see live conditions and past deviations before releasing work, scheduling rework, or changing priorities.

    In quality and compliance, automatic association of historian traces with serial numbers, batch records, inspection plans, and nonconformance records simplifies AS9100 and customer investigations.

    In MRO, test cell curves and condition data can be embedded in digital repair records to justify work scopes, component replacements, and warranty positions.

    In supplier visibility, heat treat profiles, special process curves, and supplier historian evidence can be surfaced through Connect 981 during incoming inspection and approval workflows. The benefit is fewer spreadsheets, fewer screenshots, and a stronger digital thread.

    A technician is inspecting an aerospace component in a clean manufacturing area, ensuring the equipment meets high standards for quality. This process is crucial for collecting reliable data and optimizing operations within industrial settings, where maintaining compliance and analyzing operational performance is key to reducing downtime and maintenance costs.

    Implementation Risks and Modernization Considerations

    Modernization fails when teams underestimate integration. Legacy PLCs, older SCADA, isolated test stands, network segmentation, and proprietary files often require gateways and careful OT coordination.

    Scalability matters. Size historian platforms for future sensors, multiple sites, higher tag counts, and longer retention, not only current loads.

    Governance matters too. Define tag naming, units, access rights, retention policies, ownership, and change control. Without data management discipline, even reliable historians become difficult to trust.

    Change management is equally important. A new cloud-ready historian does not guarantee adoption. Plant teams need simple ways to consume the data in daily decisions.

    A practical path is incremental: connect high-value assets first, keep mission-critical historians stable, add workflow integration above them, and apply least-privilege cybersecurity controls.

    Decision Framework: What Do You Need from Your Historian vs Your Operational Layer?

    For the historian, confirm these essentials: reliable high-frequency data collection, robust timestamps, compression controls, retention rules, data integrity, and integration with PLCs, SCADA, and DCS.

    Ask: What sampling rates are required? How many tags? How many years online? Which records support aerospace, defense, FAA, EASA, or customer retention? Which tags require raw fidelity?

    For analytics and data lakes, decide where large-scale data analysis, AI/ML, cross-site benchmarking, and corporate reporting belong.

    For the operational layer, define where historian data must drive action: work instructions, nonconformance workflows, maintenance tasks, supplier records, production review, and audit documentation. Do not overload the historian with workflow responsibilities it was never designed to handle.

    Getting Started: Using Existing Historian Data to Improve Operations with Connect 981

    Start with one high-impact area: an autoclave, engine test cell, critical machining center, or special process where delays and escapes are expensive.

    Identify relevant tags, map them to work orders and serial numbers, define events that should trigger alerts, holds, maintenance actions, or extra inspections, then configure those workflows in Connect 981.

    Connect 981 can sit alongside existing MES and ERP systems while respecting IT and OT security policies. Operations, quality, maintenance, and supply chain teams can work from the same connected evidence instead of offline reports.

    To see how current historian data can drive execution, production quality, supplier visibility, and audit-ready workflows across factories and repair sites, request a demo of the Connect 981 platform.

  • Designing Dashboards with ISO 22400 KPIs: Role-Based Examples and Patterns

    Designing Dashboards with ISO 22400 KPIs: Role-Based Examples and Patterns

    Designing Dashboards with ISO 22400 KPIs: Role-Based Examples and Patterns

    ISO 22400 defines a common language for manufacturing KPIs. It explains what concepts like availability, utilization, and order execution mean, without prescribing particular tools or visualizations. This makes the standard an excellent foundation for designing role-based KPI dashboards that are understandable and comparable across lines, plants, and even suppliers.

    This article focuses on how to turn ISO 22400 concepts into practical dashboards for operators, engineers, and managers. It does not redefine the standard or provide calculation formulas. Instead, it shows how to group KPIs, choose time horizons, and label metrics clearly so every user knows exactly what they are looking at.

    For a broader overview of standardized KPI terminology, see ISO 22400 manufacturing KPI definitions used in dashboards.

    Why Standardized KPI Definitions Matter for Dashboards

    Many dashboards fail not because they lack data, but because users interpret metrics differently. ISO 22400 helps mitigate this by providing unambiguous KPI concepts that dashboards can build on.

    Reducing confusion over similar-looking metrics

    Manufacturing dashboards often contain terms like uptime, availability, and utilization side by side. Without standard definitions, people may:

    • Assume two metrics are identical when they are not, or
    • Treat different KPIs as separate when they are actually related views of the same time or quantity structure.

    ISO 22400 addresses this by defining KPI concepts using structured time and quantity elements. When dashboards reference those concepts explicitly in labels and documentation, a user in one plant can interpret a KPI the same way as a user in another plant.

    Making cross-plant dashboards reliable and comparable

    Standardized definitions are critical when you aggregate KPIs across multiple areas, sites, or suppliers. If one site reports availability based on scheduled time and another based on calendar time, an enterprise dashboard will be misleading.

    By aligning dashboards with ISO 22400 concepts, organizations can:

    • Ensure that each KPI’s meaning is consistent at every site
    • Simplify integration among MES, historians, and BI tools
    • Reduce time spent reconciling differences during audits or performance reviews

    Using ISO 22400 as a reference for labels and descriptions

    ISO 22400 is especially useful as a naming and documentation reference. While the standard does not define how a chart should look, it does define:

    • What a KPI measures (concept description)
    • Applicable units of measure and valid ranges
    • Intended trend direction (higher is better, lower is better)
    • Typical user groups and decision contexts

    Dashboards can embed this information directly into:

    • Metric names and subtitles
    • Tooltips and help popovers
    • Data dictionaries linked from the UI

    Design Principles for ISO 2240 0-Aligned Dashboards

    The goal is not to replicate the text of ISO 22400 in your UI, but to translate its concepts into clear, usable visualizations. The following principles apply regardless of which BI or operations tool you use.

    Clear naming and tooltips with standardized definitions

    Every KPI on a dashboard should be easy to interpret without guessing. When the KPI is aligned with ISO 22400, you can use the standard as the canonical definition.

    • Use explicit names: Prefer Equipment availability (ISO 22400) over just Availability when introducing the metric, especially on cross-plant views.
    • Provide structured subtitles: For example, “Availability – proportion of planned production time when the equipment is in an operating state, ISO 22400 concept”.
    • Add KPI tooltips: Tooltips can summarize the definition, intended trend direction, and a link to internal documentation. This reduces training effort and supports new users.

    Because ISO 22400 is conceptual, your tooltip should explain the meaning in plain language, without claiming the standard prescribes that specific visualization or formula.

    Consistent units, ranges, and trend directions

    Dashboards should reflect ISO 22400’s guidance on units and trend directions wherever applicable:

    • Units: Stick to one unit per KPI (e.g., %, hours, pieces). Do not mix minutes and hours for the same metric across different charts.
    • Ranges: Configure axes to reflect logical ranges (for instance, 0–100% for rate-based KPIs).
    • Trend direction: When ISO 22400 indicates that “higher is better” or “lower is better,” align your color coding and arrows with that direction.

    For example, if a scrap rate concept is defined as a proportion of defective quantity, the dashboard should use red for higher values and green for lower values, matching the expectation that lower scrap is better.

    Separating real-time views from aggregated performance views

    ISO 22400 considers different time horizons and data aggregation levels. Dashboards should reflect these distinctions clearly instead of mixing real-time and summary views on the same panel without context.

    • Real-time dashboards focus on current equipment states and near-term behavior (e.g., current shift). They help operators respond quickly.
    • Aggregated dashboards focus on shifts, days, weeks, or order lifecycles. They help engineers and managers analyze trends and variability.

    Labeling sections such as “Real-time states (current line)” and “Shift summary (ISO 22400-aligned KPIs)” reduces misinterpretation. It also aligns with the standard’s distinction between raw signals, derived indicators, and aggregated KPIs.

    Dashboards for Operators and Shift Supervisors

    Operator-facing dashboards should prioritize immediacy and clarity. ISO 22400’s equipment states and time categories provide a useful backbone for these views.

    Focusing on equipment states and immediate KPIs

    Operators need to know what equipment is doing right now and whether the current shift is on track. Practical design elements include:

    • State tiles per work unit or machine: Each tile shows the state (e.g., RUN, STOP, IDLE, SLOW) with color coding and minimal text.
    • Shift progress bar: Indicates progress against planned production quantity or planned busy time.
    • Key ISO 22400-oriented KPIs for the shift: For example, an availability-like indicator, an effectiveness or utilization indicator, and a simple quality indicator.

    These metrics should be narrow in scope, relating to the current line or work center only, to reduce cognitive load.

    Visual cues for downtime, speed loss, and quality issues

    ISO 22400 distinguishes among different time categories and quantity categories. Dashboards can turn those structures into visual cues:

    • Downtime: A timeline bar per machine that segments time into categories aligned with equipment states (planned stop, unplanned stop, idle, running). Each segment uses consistent colors across the plant.
    • Speed loss: A simple gauge that compares current output rate with a reference rate, clearly labeled as a performance concept.
    • Quality issues: A compact card summarizing accepted quantity vs. defective quantity, with a clear ratio and trend arrow.

    The intent is not to introduce complex analytics but to give operators fast, standardized signals about where problems are occurring.

    Using state-based indicators aligned with ISO 22400

    ISO 22400 describes equipment states such as RUN, STOP, IDLE, and SLOW as foundations for time-based KPIs. Dashboards can reflect this model without implying that the standard mandates any specific UI:

    • State distribution charts: Pie or stacked bar charts showing the share of the shift spent in each state.
    • Current state panel: A card per machine showing the current state, time in that state, and the last state change time.
    • Simple alarms: Rules such as “more than X minutes in UNPLANNED STOP” highlighted visually, derived from standardized state categories.

    By anchoring these visuals in defined state concepts, operators and supervisors can talk about performance using a shared vocabulary.

    Dashboards for Engineers and Continuous Improvement Teams

    Engineering and continuous improvement teams require deeper analysis than operators. They work with breakdowns of time, quantities, and orders across longer periods, while still relying on the same ISO 22400 concepts.

    Deeper breakdowns of time and quantity categories

    ISO 22400 expresses equipment-related KPIs as combinations of time elements (busy time, operating time, downtime categories) and quantity elements (good quantity, defective quantity). Dashboards for engineers can surface these components explicitly:

    • Time structure views: Charts that decompose a week of operation into planned time, unplanned stops, speed losses, and other structured categories.
    • Quantity structure views: Plots showing produced quantity, accepted quantity, and defective quantity by product or order, with ratios derived from ISO 22400 concepts.
    • Order lifecycle views: For each production order, display start time, execution time, waiting time, and completion time in alignment with the standard’s order-related definitions.

    Correlations among related ISO 22400 KPIs

    ISO 22400 KPIs are conceptually interrelated. For example, changes in one equipment-related indicator can propagate to order performance or resource utilization. Dashboards can emphasize these relationships without overcomplicating the UI:

    • Scatter plots: Compare two KPIs (e.g., a utilization concept vs. a quality-related ratio) across lines or orders.
    • Matrix views: Show a grid of related KPIs for each work center, helping engineers spot patterns and trade-offs.
    • Drill-down paths: Allow users to move from a summary KPI to underlying time and quantity components.

    These patterns respect the standard’s intention: KPIs are built from shared time and quantity structures, not isolated figures.

    Identifying patterns across lines and work centers

    Engineers frequently compare performance among lines, areas, or work units. Because ISO 22400 describes KPIs at multiple levels (work unit, line, area, site), dashboards can support these comparisons more reliably:

    • Benchmark tables: A table of key standardized KPIs for each line or work center, sorted by best or worst performance.
    • Heatmaps: Color-coded grids where each cell represents a line/KPI combination for a given time period, highlighting outliers.
    • Multi-line trend charts: Show how a chosen KPI evolves over time across several work centers, assuming all use the same definition.

    Because the underlying definitions are standardized, engineers can have greater confidence that differences in values reflect real performance, not inconsistent calculation methods.

    Dashboards for Plant and Enterprise Management

    Management dashboards aggregate information across activities and locations. ISO 22400’s role here is to ensure that when a KPI is compared across plants, everyone knows it means the same thing.

    Aggregated ISO 22400 KPIs across areas and sites

    Typical design elements for management-level views include:

    • Site comparison panels: Cards for each site showing a small set of ISO 22400-aligned KPIs with trend arrows and values relative to targets.
    • Area-level roll-ups: Summaries by area or line family that combine local KPIs into site-level metrics while preserving the same conceptual definitions.
    • Exception lists: Automatically generated lists of lines or areas whose KPIs deviate beyond configured thresholds.

    Because managers often do not work with the raw data, clarity in naming and consistent units become even more important.

    Benchmarking plants and suppliers on common definitions

    When plants or suppliers report using ISO 22400-aligned KPIs, dashboards can use those values for fair benchmarking:

    • Ranked views: Rank sites or suppliers by a selected standardized KPI.
    • Quartile charts: Show the distribution of a KPI across all sites to highlight top and bottom performers.
    • Stability vs. performance: Compare average KPI values with variability measures, emphasizing consistency as well as level.

    These views rely on the fact that everyone is using the same conceptual KPI definition, even if local systems and data sources differ.

    Blending standardized KPIs with financial indicators

    ISO 22400 focuses on manufacturing operations, not financial accounting. Nevertheless, dashboards often need to show both operational and financial metrics together. A practical approach is:

    • Keep labels explicit: Clearly distinguish ISO 22400-aligned KPIs (e.g., utilization, availability, quality rate) from financial KPIs (e.g., cost per unit, margin).
    • Link, don’t merge: Show relationships (such as a trend where improved equipment-related KPIs correlate with lower cost per unit) without relabeling financial metrics as ISO 22400 KPIs.
    • Use shared dimensions: Aggregate both operational and financial metrics by the same site, line, or product hierarchy, so users can view them side by side.

    This preserves the integrity of the standard while still supporting business decisions that span operations and finance.

    Implementation Tips Across BI and Operations Tools

    ISO 22400 is technology-neutral. It does not mandate specific dashboards, databases, or architectures. Nonetheless, its concepts can guide how you implement KPIs in BI platforms, MES dashboards, or custom operations portals.

    Using a central platform as a single KPI source

    Many organizations reduce complexity by designating a central platform as the single source of standardized KPI definitions and calculations. That platform maps raw data from ERP, MES, historians, or other systems into ISO 22400 concepts, then distributes KPIs to various dashboards.

    Dashboards in BI tools, shop-floor UIs, and management portals all consume the same KPI objects, which improves consistency when metrics are updated or extended.

    Maintaining definition consistency across tools

    Even with a central KPI model, inconsistencies can appear when teams implement local dashboards. To reduce this risk:

    • Maintain a data dictionary: For each ISO 22400-aligned KPI, capture its name, description, unit, trend direction, and calculation method (where applicable) in a shared catalog.
    • Expose metadata in the UI: Allow dashboard users to see the KPI definition via tooltips or info panels, so they can verify that a metric is standardized.
    • Control KPI creation: Establish a review process for new or modified KPIs to prevent overlapping or conflicting definitions.

    Periodic reviews to prevent KPI drift and clutter

    Over time, dashboards can accumulate too many metrics, or KPIs can drift away from their original ISO 22400-aligned meaning. Periodic reviews help keep dashboards clean and trustworthy:

    • Check alignment: Confirm that each KPI that claims ISO 22400 alignment still matches the underlying concept and attributes.
    • Retire unused metrics: Remove or archive KPIs and visualizations that are rarely used, replacing them with clearer views when needed.
    • Update documentation: When KPI definitions change, update tooltips and data dictionaries promptly so dashboards do not lag behind.

    These practices respect the boundary of the standard: ISO 22400 defines concepts, while each organization governs how those concepts are applied and maintained in its own dashboards.

    Clarifying What ISO 22400 Does and Does Not Specify for Dashboards

    It is important to emphasize that ISO 22400 does not prescribe particular dashboard designs, colors, chart types, or software tools. The examples in this article are illustrative only. They show how ISO 22400 concepts can inform dashboard structure and labeling, not how dashboards must look to be compliant with the standard.

    In practice, organizations adapt the concepts to their own environments:

    • Visualizations can be implemented in any BI, MES, or custom tool.
    • Additional, non-standard KPIs may appear alongside ISO 22400-aligned metrics.
    • Layout choices (cards, tables, heatmaps, timelines) are design decisions, not matters of standardization.

    The strength of ISO 22400 in dashboard design lies in its consistent vocabulary for time, quantity, and KPI concepts. Dashboards that adopt this vocabulary become easier to interpret, compare, and automate across the manufacturing network.

    Summary

    ISO 22400 provides conceptual definitions for manufacturing KPIs, not fixed dashboards. By using its standardized terminology and KPI attributes, you can design operator, engineer, and management dashboards that share the same underlying meanings even when they differ in layout or tool.

    Clear naming, robust tooltips, consistent units, and the separation of real-time and aggregated views all contribute to trustworthy dashboards. Role-based designs aligned with ISO 22400 help operators act quickly, engineers analyze deeply, and managers compare plants fairly, without forcing everyone into the same visual template.

    Organizations remain free to decide which KPIs matter for their strategy, how to calculate them in detail, and how to respond to changes over time. ISO 22400 supplies the language; good dashboard design turns that language into everyday decisions on the shop floor and in the boardroom.

    For teams putting lean manufacturing and process optimization into daily operation, lean manufacturing and process optimization, a connected execution platform, Connect 981’s aerospace execution solutions help connect the concept to traceability, work-order reality, and audit-ready evidence.

    The same operating model also depends on real aerospace execution examples, Connect 981’s aerospace operations guidance, practical aerospace operations FAQs, ISO 22400 KPI governance, especially when decisions have to move across quality, production, suppliers, and program leadership without losing context.

  • The Limits of ISO 22400: When and How to Use Custom KPIs

    The Limits of ISO 22400: When and How to Use Custom KPIs

    ISO 22400 gives manufacturers a common language for performance measurement, not a fixed list of KPIs or improvement recipes. To use the standard effectively, you need to understand what it standardizes, what it intentionally leaves undecided, and how to design custom KPIs that work alongside it without creating confusion.

    This article explains the practical limits of ISO 22400 and provides concrete guidance for introducing complementary, non-standard KPIs in a controlled way. The goal is to balance cross-site comparability with the flexibility you need for your industry, plants, and improvement programs. For a broader overview of the standard’s scope and core KPI framework, see our hub article on ISO 22400 manufacturing KPIs and their scope and boundaries.

    Understanding What ISO 22400 Intentionally Leaves Open

    ISO 22400 defines concepts, terminology, and KPI structures for manufacturing operations management. It is focused on semantic clarity and interoperability across systems and organizations. To preserve that neutrality, the standard deliberately avoids taking positions on business strategy or local optimization tactics.

    No prescriptions on strategy, targets, or KPI selection

    ISO 22400 clarifies what indicators such as availability, utilization, or order execution reliability mean. It does not decide which of these indicators matter most to your business or how you should prioritize them.

    • No strategic priorities: The standard does not say whether you should focus first on OEE, throughput, energy efficiency, or delivery reliability.
    • No target values: It does not define what constitutes a good, acceptable, or poor value for any KPI. A 75% OEE may be excellent in one highly variable environment and insufficient in a stable, high-volume line.
    • No required KPI set: Although ISO 22400-2 lists 34 KPIs, this list is illustrative and conceptual, not a mandatory checklist. You can use some, all, or none, and you can add your own.

    Because of this, it would be a misunderstanding to use ISO 22400 as a ready-made performance scorecard. You still need a separate strategy process to decide which KPIs are truly key in your context and how they support business objectives.

    No enforcement of granularity, weighting, or thresholds

    Another intentional limit is that the standard does not prescribe how detailed your KPIs must be or how they should be aggregated.

    • Granularity choices: ISO 22400 can be applied to work units, lines, areas, sites, or orders. It does not say whether your “official” OEE should be calculated by machine, by line, or by plant.
    • No weighting rules: If you combine KPIs into a composite score (for example, a plant performance index), the standard does not dictate how to weight availability vs. quality vs. cost.
    • No thresholds or traffic lights: Red/yellow/green bands, control limits, and early-warning rules are left to your internal standards and governance.

    These omissions are not gaps; they are boundaries. ISO 22400 aims to stay broadly applicable across industries and business models. Mandating granularity or thresholds would make it too rigid for many use cases.

    No required calculation algorithms or visualization methods

    While ISO 22400 describes KPI concepts, it often stops short of prescribing a single, implementation-ready formula or visualization.

    • Calculation details: It defines logical relationships between time categories and quantities, but it does not mandate specific sampling rates, filtering rules, or how to handle ambiguous events.
    • Data preparation: It does not tell you exactly how to reconcile signals from multiple systems (for example, reconciling MES and historian time stamps) as long as the result conforms to the conceptual definitions.
    • Visualization: There is no requirement to use waterfalls, Pareto charts, Sankey diagrams, or any specific dashboard style. The standard is technology-neutral.

    This gives organizations freedom but also creates the need for internal conventions. If two plants interpret the same KPI differently in terms of data preparation, they will both be aligned to ISO 22400 conceptually yet still be hard to compare. Internal alignment on implementation choices is therefore crucial.

    Identifying Gaps Where Custom KPIs Are Needed

    Because ISO 22400 is industry-neutral and deliberately limited in scope, many organizations will need custom KPIs that go beyond its 34 examples. The challenge is to recognize where these additions are justified and how to design them responsibly.

    Regulatory or sector-specific requirements

    Some industries operate under regulatory regimes or contractual frameworks that demand indicators outside the standard’s scope.

    • Aerospace and MRO: Metrics around airworthiness release times, maintenance turnaround time (TAT) per aircraft, or compliance with mandatory inspections are unlikely to appear in a general manufacturing standard.
    • Pharmaceuticals: Batch genealogy completeness, deviation closure time, and validated cleaning cycle performance are driven by GMP and similar regulations.
    • Food and beverage: Shelf-life-related quality metrics, allergen changeover performance, or sanitation window adherence might be essential but non-standard.

    In these cases, custom KPIs are not optional extras; they are required to demonstrate compliance or meet contractual obligations. ISO 22400 remains useful as a conceptual backbone, but it cannot replace sector-specific performance measures.

    Company-specific process characteristics

    Two companies in the same industry may have very different process architectures, automation levels, and risk profiles. This often calls for tailored KPIs.

    • Unique technologies: An additive manufacturing shop may track build-job restart rate or laser utilization in ways that do not map cleanly to the standard KPI set.
    • Highly customized products: Engineer-to-order environments may need indicators focused on engineering change propagation, first-article approval cycles, or configuration accuracy.
    • Complex supply networks: Organizations with deep subcontracting structures may introduce KPIs that track external processing reliability or inbound quality in special ways.

    These indicators can still be aligned with ISO 22400 by reusing concepts such as work units, states, or order-level views, even when the metric itself is non-standard.

    Innovation and continuous improvement programs

    Improvement initiatives often experiment with new ways of measuring performance before it makes sense to standardize those metrics widely.

    • Pilot KPIs: A plant might trial an operator workload balance index, a changeover robustness score, or a digital-ization adoption indicator for a limited time.
    • Lean and Six Sigma projects: DMAIC phases often introduce temporary diagnostic metrics that are too specific or short-lived to be candidates for formal inclusion in internal standards.
    • Data science and analytics: Predictive maintenance models or anomaly detection may produce composite health scores that are not (yet) part of any standard.

    These innovation-driven KPIs are legitimate, but they must be clearly distinguished from formally standardized indicators and carefully documented to avoid misinterpretation.

    Design Principles for Custom KPIs Alongside ISO 22400

    When you add KPIs beyond ISO 22400, your goal should be complementarity, not competition. Good design preserves the benefits of standardization while giving you the freedom to measure what matters locally.

    Reusing ISO 22400 concepts and terminology where possible

    The quickest way to keep your KPI landscape coherent is to base custom metrics on ISO 22400 building blocks.

    • Use standard objects: Define measurement objects using the same hierarchy (work unit, work center, area, site, enterprise) that ISO 22400 and IEC 62264 reference.
    • Reuse time categories and states: If your custom indicator depends on machine behavior, map its logic to the RUN, STOP, IDLE, and other states used to derive time-based KPIs in the standard.
    • Align quantity definitions: Distinguish clearly between produced quantity, accepted quantity, and rejected quantity using ISO 22400 terminology wherever applicable.

    By grounding your custom KPIs in the same conceptual foundation, you simplify both technical integration and human understanding.

    Avoiding conflicting names and overlapping definitions

    Confusion often arises when two metrics have similar names but different meanings, or when different departments define the same term differently. To prevent this:

    • Do not overload ISO names: Avoid reusing terms such as “availability,” “utilization,” or “OEE” with non-standard meanings. If you need a variant, give it a distinct name (for example, “maintenance availability index”).
    • Flag variants explicitly: If you intentionally deviate from an ISO 22400 definition, indicate this clearly in the KPI documentation and name, such as “OEE (local variant – setup included in busy time).”
    • Check for overlap: Before creating a new KPI, check whether an existing one already covers most of the need. Redundant indicators dilute focus and create reporting overhead.

    This naming discipline helps everyone understand which KPIs are truly comparable across sites and which are local or experimental.

    Documenting derivations and assumptions clearly

    Custom KPIs often chain together several data transformations and assumptions. Without documentation, they become opaque and hard to trust.

    • Define purpose and users: State why the KPI exists (e.g., “to monitor maintenance-induced delays in MRO hangars”) and who is expected to act on it.
    • Specify inputs and logic: List all input data elements, their sources, and the calculation steps. Show how it relates (if at all) to ISO 22400-defined indicators.
    • Describe limitations: Note approximations, data quality constraints, or contexts where the KPI should not be used for comparison or incentives.

    Good documentation transforms a custom KPI from a black box into a transparent tool that can be tested, audited, and improved.

    Labeling and Cataloging Custom KPIs

    Once you go beyond the ISO 22400 set, transparency depends on how well you label and organize your KPIs. Treating them as first-class, cataloged objects reduces misinterpretation and maintains comparability where it matters.

    Distinguishing ISO 22400-based KPIs from non-standard ones

    In your KPI catalog or reporting tools, make it obvious which indicators are based on ISO 22400 and which are not.

    • Use explicit flags: Add metadata such as standard_reference = “ISO 22400” or standard_reference = “none (custom)”.
    • Link to definitions: For each KPI that is directly aligned with ISO 22400, reference the relevant part and clause in the documentation.
    • Clarify status: Distinguish between approved standard KPI, site-specific KPI, and experimental KPI so that users know how much governance stands behind each metric.

    This clarity prevents users from assuming that every metric in a dashboard is part of an international standard when, in reality, many are local additions.

    Tagging KPIs by domain, level, and purpose

    Effective cataloging includes several dimensions of metadata beyond just “standard” vs. “custom.” At minimum, consider:

    • Domain: Production, maintenance, quality, logistics, energy, safety, compliance, etc.
    • Organizational level: Enterprise, site, area, line, work center, work unit, order/lot.
    • Time horizon: Real-time, shift, day, week, month, order lifecycle.
    • Purpose: Monitoring, early warning, diagnosis, optimization, compliance reporting, incentive calculation.

    These tags make it easier to search, filter, and govern KPIs as your landscape grows across multiple sites and business units.

    Using a catalog or dictionary that references the standard

    Instead of maintaining KPI definitions in scattered documents or local spreadsheets, consolidate them into a centralized catalog.

    • Single source of truth: A KPI dictionary ensures that the name, definition, formula, and ownership of each KPI are maintained in one place.
    • Explicit linkage to ISO 22400: Where applicable, the catalog entry should note which ISO 22400 concept or KPI it builds upon, including any modifications.
    • Lifecycle management: Track when KPIs are introduced, revised, or retired so that old reports can be interpreted correctly.

    Many organizations implement this catalog inside their BI platform, MES, or a dedicated data governance tool, but the principle is the same: KPIs should be managed like master data, not ad hoc artifacts.

    Examples of Complementary, Non-Standard KPIs

    To illustrate how custom KPIs can coexist with ISO 22400, consider some examples from different domains. None of these are official parts of the standard, but they can be built on its concepts and integrated into a coherent KPI framework.

    Domain-specific metrics in aerospace and MRO

    Aerospace manufacturing and maintenance, repair, and overhaul (MRO) operations must handle complex traceability, safety, and regulatory requirements. Typical complementary KPIs include:

    • Turnaround Time (TAT) per Aircraft or Work Package: Measures the elapsed time from induction to release to service. It may be broken down by work unit or area using the same hierarchical levels that ISO 22400 recognizes.
    • On-Time Maintenance Release Rate: Percentage of maintenance events completed on or before the planned release time, linked to production-order-like objects in the ISO framework.
    • Non-Routine Work Ratio: The share of maintenance hours triggered by unplanned findings, complementing standard utilization or availability KPIs.

    These metrics address realities that ISO 22400, as a general manufacturing standard, does not cover, while still leveraging standard concepts such as orders, work units, and time categories.

    Lean and continuous improvement indicators

    Lean manufacturing, TPM, and other improvement methodologies often rely on indicators that do not appear as such in ISO 22400 but can use its terminology.

    • Changeover Performance Index: Relates actual changeover duration to a target or benchmark, using ISO-aligned time definitions to capture setup and adjustment states.
    • Flow Efficiency: Ratio of value-adding time to total lead time for a product family or order type, reusing the standard’s differentiation between active and idle states.
    • Kaizen Implementation Rate: Measures the percentage of proposed improvements that are implemented, operating at a higher organizational level than most ISO 22400 KPIs.

    These indicators support culture and process change while benefiting from consistent underlying definitions of states, orders, and time horizons.

    Combined financial-operational performance indexes

    ISO 22400 focuses on operational KPIs at manufacturing operations management level, while many business decisions demand indicators that combine cost, revenue, and operational performance.

    • Cost per Good Unit Shipped: Combines operational data (good quantity, scrap, rework) with cost information from ERP systems.
    • Contribution Margin per Constraint Hour: Ties product margins to utilization of bottleneck resources modeled as work units or lines.
    • Service-Level-Adjusted Utilization Index: Adjusts standard utilization measures with penalties for missed delivery windows or expedited freight.

    These composite indicators sit at the interface between Level 3 (MOM) and Level 4 (business planning) and must be clearly marked as outside the formal ISO 22400 scope, even when they reuse its concepts.

    Maintaining Coherence in KPI Landscapes Over Time

    Even well-designed KPI frameworks can drift over the years as processes change, systems are replaced, and new plants are acquired. Keeping your KPI landscape coherent requires ongoing governance, not a one-time project.

    Periodic reviews to reduce duplication and drift

    Regularly review your KPI portfolio to ensure it remains aligned with strategy and standards.

    • Identify duplicates and near-duplicates: Consolidate metrics that measure essentially the same thing but use slightly different formulas or names.
    • Retire obsolete indicators: Remove KPIs that no longer inform decisions or reflect current process realities.
    • Confirm ISO alignment: Check that KPIs labeled as ISO 22400-based still match the standard’s definitions, especially after system upgrades or model changes.

    These periodic reviews prevent KPI bloat and help keep dashboards meaningful and actionable.

    Using platforms like the KPI hub to maintain clarity

    Reporting and integration platforms can embed ISO 22400 concepts and your internal KPI catalog so that users see consistent definitions wherever they work.

    • Centralized definitions: Dashboards, reports, and analytics should all reference the same KPI dictionary and explicitly indicate when a metric is standard-aligned vs. custom.
    • Integrated metadata: Tooltips, drill-downs, and API responses can expose KPI metadata (definition, owner, standard reference, calculation version) so users understand what they are seeing.
    • Controlled change management: Changes to KPI formulas or status (for example, from experimental to standard) should flow through a formal governance process and be reflected in all consuming systems.

    By treating KPI definitions as shared infrastructure, you reduce local improvisation that might undermine comparability.

    Aligning internal standards with evolving business needs

    Finally, remember that your internal KPI standards must evolve with your business model, technology, and regulatory environment, while still staying grounded in widely understood concepts like those in ISO 22400.

    • Revisit key KPIs: As new products or services emerge, some metrics may become more or less relevant; adjust your official KPI set accordingly.
    • Incorporate proven custom KPIs: When experimental indicators consistently provide value, consider promoting them into your internal standard, with full documentation and governance.
    • Monitor external standards: Keep an eye on updates to ISO 22400 and related standards so that your internal definitions do not drift away from the broader ecosystem.

    This continuous alignment ensures that your KPI framework remains both locally effective and externally interpretable, preserving the benefits of standardization without sacrificing flexibility.

    Conclusion: Using ISO 2240 0 as a Stable Backbone, Not a Complete Menu

    ISO 22400 provides a powerful, shared vocabulary for manufacturing KPIs, but it intentionally stops short of telling you which KPIs to choose, what targets to set, or how to visualize performance. Those decisions are, and should remain, specific to your strategy, industry, and operations.

    By recognizing the limits of the standard, you can design custom KPIs that complement it rather than conflict with it. Reuse ISO 22400 concepts, avoid ambiguous naming, document your assumptions, and maintain a governed KPI catalog. Over time, this approach lets you add the regulatory, sector-specific, financial, and innovation-driven indicators you need while keeping cross-site and cross-partner comparability intact.

    For a broader discussion of the ISO framework itself and its role in interoperable performance measurement, refer back to our hub on core ISO 22400 manufacturing KPI scope and boundaries. Start with a solid backbone, then extend it carefully to reflect what truly matters in your operations.

    For teams putting aviation and cross-sector software into daily operation, ISO 22400 KPI governance, aviation and cross sector software, a connected execution platform help connect the concept to traceability, work-order reality, and audit-ready evidence.

    The same operating model also depends on Connect 981’s aerospace operations guidance, practical aerospace operations FAQs, especially when decisions have to move across quality, production, suppliers, and program leadership without losing context.

    For teams putting aviation and cross-sector software into daily operation, Connect 981’s aerospace execution solutions, real aerospace execution examples help connect the concept to traceability, work-order reality, and audit-ready evidence.

  • How ISO 22400 Enables Data Integration for Manufacturing KPIs

    How ISO 22400 Enables Data Integration for Manufacturing KPIs

    ISO 22400 is widely discussed as a standard for defining manufacturing KPIs, but its real power shows up when you start integrating data across systems. When ERP, MES, SCADA, historians, and analytics tools all describe KPIs differently, integration projects become slow, fragile, and hard to maintain. ISO 22400 offers a shared semantic layer so that these systems can talk about performance in the same way, even if they use different technologies underneath.

    This article explains how ISO 22400 supports interoperability for manufacturing KPIs by standardizing KPI concepts, names, units, and time structures. It focuses on semantic alignment rather than specific protocols or products, and highlights integration patterns you can use in a multi-vendor, multi-plant environment.

    For teams putting erp / mes / plm interoperability into daily operation, data mapping and system interoperability, MES execution control, shop floor execution control help connect the concept to traceability, work-order reality, and audit-ready evidence.

    The same operating model also depends on ERP, MES, and PLM integration paths, a connected execution platform, Connect 981’s aerospace execution solutions, real aerospace execution examples, especially when decisions have to move across quality, production, suppliers, and program leadership without losing context.

    For a broader view of the standard, definitions, and KPI families, see the related overview on ISO 22400 manufacturing KPIs, which this article builds on.

    The Integration Problem: Many Systems, Many KPI Definitions

    How KPI semantics fragment across tools and vendors

    Most manufacturing organizations run a mix of systems from different eras and suppliers: an ERP for orders and finance, one or more MES platforms, SCADA systems and PLCs on the shop floor, a historian for time-series data, plus separate quality, maintenance, and BI tools. Each system tends to define KPIs in its own way.

    • Different names for similar concepts: one system reports availability, another uses uptime, a third uses run ratio.
    • Different underlying time bases: some metrics use calendar time, others shift time, others only count scheduled time.
    • Different inclusion/exclusion rules: one tool includes planned maintenance in downtime; another doesn’t.
    • Different units and ranges: capacities in pieces/hour versus kg/hour, efficiencies as percentages versus decimals.

    On a single line with a single vendor’s stack, this may be manageable. Across multiple sites, vendors, and business units, the result is semantic fragmentation: numbers that look similar but mean different things.

    Hidden translation layers in custom integrations

    To cope with this fragmentation, teams build custom integrations and transformation logic:

    • Hard-coded mappings between KPI names and meanings in ETL jobs.
    • Spreadsheet-based “translation rules” maintained by a few experts.
    • BI models that silently reinterpret source metrics to make reports comparable.

    These translation layers are often implicit, poorly documented, and rarely tested against a formal reference. As systems evolve, they drift, and integration teams spend more time reconciling conflicting KPI values than enabling new capabilities.

    When a plant manager asks, “Why does my OEE here differ from what finance sees in the corporate dashboard?” the cause is often a mismatch in definitions, not a data transmission error.

    Why interoperability is about meaning, not just transport

    IT and OT integration efforts often start by choosing a transport mechanism: OPC UA, REST APIs, message queues, CSV exports, or integration platforms. These choices matter, but they don’t solve semantic conflicts. Two systems can exchange JSON over HTTPS perfectly and still disagree on what availability or utilization means.

    Semantic interoperability is the ability of systems to exchange data with shared understanding of its meaning. ISO 22400 targets exactly this level: it standardizes how manufacturing KPIs are conceptually defined so that:

    • When one system says “equipment utilization,” another system can interpret it unambiguously.
    • Cross-plant comparisons do not require manual re-interpretation.
    • Contracts and service-level agreements can reference standard KPI definitions.

    Transport standards answer “How do we move the data?” ISO 22400 answers “What do these KPI values mean once they arrive?” Both are needed for dependable integration.

    ISO 22400 as a Semantic Reference for KPI Data

    Standardized names and definitions for key KPIs

    ISO 22400 defines a structured vocabulary for KPIs used in manufacturing operations management. It provides:

    • Standard KPI names (e.g., different variants of utilization and effectiveness).
    • Conceptual descriptions of what each KPI measures.
    • Associated attributes such as applicable units of measure, expected value ranges, and trend directions.
    • Context such as typical users (operators, supervisors, managers) and usage scenarios.

    For integration work, this becomes a reference catalog. Rather than inventing a new KPI each time a system is integrated, teams can align with an existing ISO 22400 concept where appropriate. This reduces the number of unique semantics that must be supported and documented.

    Aligning time and state concepts across systems

    Manufacturing KPIs are heavily time-dependent: busy time versus idle time, planned versus unplanned downtime, shift boundaries, and so on. ISO 22400 provides:

    • Common state terminology for equipment and operations (e.g., RUN, IDLE, STOP, SLOW).
    • Time-structure concepts such as planned time, operating time, downtime categories, and order execution time.
    • Links between states, time categories, and KPIs so that the same event stream yields consistent indicators across systems.

    When SCADA, MES, and a historian all classify equipment states differently, integrating data is difficult. When they all use the same conceptual state model aligned with ISO 22400, time-derived KPIs can be calculated or aggregated consistently, even if implementations differ.

    Using ISO 22400 as a shared contract between parties

    Because ISO 22400 is a publicly available standard, it can be treated as a neutral reference in contracts, system specifications, and integration designs. For example:

    • A supplier can agree to report equipment utilization as defined in ISO 22400 for a specific production cell.
    • An MES vendor can document which ISO 22400 KPIs it provides natively and how they are exposed in APIs.
    • System integrators can design data models and transformations that explicitly reference the ISO 22400 concepts they implement.

    This shared contract reduces ambiguity and negotiation overhead. It also makes it easier to validate that an integration behaves as expected: you can compare KPI implementations against the standard’s definitions rather than against informal descriptions.

    Common Integration Patterns for ISO 22400 KPIs

    Central hub vs. point-to-point mapping

    There are two broad approaches to aligning KPI semantics across systems.

    Point-to-point mapping connects each pair of systems directly:

    • Each interface defines its own mapping from local KPIs to some shared report.
    • Semantic adjustments are performed individually per integration.
    • Complexity grows quickly as more systems are added.

    This approach can work for small environments, but it tends to lead to a web of bespoke mappings that are hard to maintain and audit.

    Central semantic hub architectures instead map each system to a shared semantic model based on ISO 22400:

    • ERP, MES, SCADA, historian, and analytics tools each integrate with a central data model.
    • That model explicitly encodes ISO 22400 KPI concepts and relationships.
    • New systems only need to understand the semantic hub, not every other system.

    In such a hub, you can represent KPIs with clear attributes (name, ISO reference, units, time behavior, application scope) and let downstream reports or services consume them without reinterpreting their meaning.

    Using middleware or integration platforms

    Middleware and integration platforms can support ISO 22400-based interoperability when they incorporate a semantic layer rather than just moving data fields around. Typical capabilities include:

    • Canonical KPI models aligned with ISO 22400 that sit between source and target systems.
    • Mapping rules that transform local metrics into standardized KPIs.
    • Validation policies that check whether incoming values conform to expected units and ranges.
    • Versioned schemas that allow KPI definitions to evolve in a controlled way.

    The standard itself does not mandate any particular middleware product or technology. What matters is that whatever integration mechanism you use can represent and preserve KPI semantics, not just transport values.

    Exchanging KPI data with suppliers and customers

    Manufacturers increasingly share KPI data with external partners: contract manufacturers, component suppliers, logistics providers, or end customers with performance-based contracts. ISO 22400 can form the basis for such exchanges:

    • Common expectations: both parties agree on what a KPI name means and how it is structured.
    • Comparable performance: multiple suppliers can be benchmarked using the same KPI definitions.
    • Reduced negotiation effort: contractual appendices can reference standardized definitions instead of lengthy bespoke descriptions.

    Because ISO 22400 is transport-agnostic, partners can exchange KPI data via APIs, file transfers, or portals while still relying on the same conceptual definitions.

    Designing Interfaces with KPI Semantics in Mind

    Explicitly exposing KPI definitions in APIs

    To realize the benefits of ISO 22400 interoperability, interfaces should not only expose KPI values but also the metadata that ties those values to standard definitions. Useful practices include:

    • Including a KPI identifier that can be mapped to an ISO 22400 definition.
    • Exposing units of measure and time behavior (e.g., shift-based, order-based, rolling period) as part of the API schema.
    • Providing descriptions and context that clearly align with the standard’s conceptual language.
    • Publishing API documentation that references the corresponding ISO 22400 terms where applicable.

    This transforms an API from a set of loosely defined fields into an explicit API contract for KPI data, making semantic alignment easier across consuming systems.

    Handling unit conversions and ranges

    Even when KPI definitions are aligned, units and ranges may differ between systems. ISO 22400 helps by specifying expected units and logical ranges for many KPIs, but integration designers still need to:

    • Implement explicit unit-conversion rules where local units differ from the standard (e.g., minutes vs. seconds, pieces vs. kilograms).
    • Validate that incoming values fall within plausible ranges for the KPI, flagging outliers for review.
    • Ensure that percentage-based KPIs are consistently represented (e.g., 0–1 versus 0–100).

    These rules should be documented at the semantic level: “this field represents utilization as per ISO 22400, expressed as a percentage from 0–100.” This way, the same logic can be reused across integrations.

    Ensuring version compatibility when definitions evolve

    Over time, organizations may refine how they implement particular KPIs, or the underlying systems may introduce new variants. To maintain interoperability:

    • Version KPI definitions in your central model, with clear change histories.
    • Expose a version attribute in APIs so consumers know which definition applies.
    • Provide deprecation paths when legacy KPIs are replaced or redefined.
    • Retain mappings to ISO 22400 concepts even if your internal labels change.

    ISO 22400 itself is stable over multi-year periods, providing a steady reference point even as local implementations evolve. Using the standard as an anchor reduces the risk of silent semantic drift between systems.

    Example Architecture: ISO 2240 0-Aligned Connected Plant

    Role of ERP, MES, SCADA, historians, and BI tools

    In a typical connected-plant architecture, multiple systems contribute pieces of the data required to compute ISO 22400-aligned KPIs:

    • ERP supplies order data, planned schedules, and cost information for higher-level reporting.
    • MES orchestrates production orders, tracks execution, and often calculates operational indicators.
    • SCADA and control systems provide real-time equipment states, alarms, and counts.
    • Historians record time-series data, such as state changes and sensor values, that underpin time- and quantity-based indicators.
    • BI and analytics tools aggregate KPI values, visualize trends, and support decision-making.

    ISO 22400-aligned integration does not require replacing any of these systems. Instead, it focuses on how they represent and exchange performance concepts.

    How a platform like an ISO 22400-based KPI model standardizes KPI semantics

    A central KPI model—conceptually similar to an ISO 22400-based KPI model—can sit between operational systems and reporting tools. Such a model typically:

    • Defines canonical KPI entities aligned with ISO 22400, including names, descriptions, units, and applicable contexts.
    • Maps raw events and signals (e.g., state changes from SCADA) into standardized time categories and quantities.
    • Aggregates data at different organizational levels (work unit, line, area, plant, order) using consistent rules.
    • Exposes a normalized API or data layer that BI, analytics, and external partners can consume.

    This model acts as the semantic backbone of the connected plant, ensuring that all consumers of KPI data see the same meanings even if the technical implementations behind them differ.

    Supporting both standardized and custom KPIs in one model

    Most organizations need both standardized KPIs (for comparability and integration) and custom KPIs (for domain- or company-specific needs). A well-designed KPI model:

    • Labels which KPIs are ISO 22400-aligned and which are custom.
    • Structures custom KPIs using similar attributes (units, ranges, context) for consistency.
    • Allows composite metrics that combine standardized and custom indicators without blurring their definitions.
    • Maintains clear metadata so that consumers can filter for “standardized only” when necessary (e.g., cross-plant benchmarks).

    This approach respects the boundaries of ISO 22400 while still enabling innovation in performance measurement.

    Governance and Maintenance of KPI Interfaces

    Managing integrations as KPIs change or expand

    KPI interoperability is not a one-time project. As operations change, new lines are added, or business priorities shift, KPI sets evolve. Sustainable governance typically includes:

    • A central catalog of KPIs, annotated with ISO 22400 mappings where applicable.
    • Change-management processes that assess downstream integration impacts when KPIs are added or redefined.
    • Regular reviews with stakeholders (operations, quality, IT/OT) to ensure the KPI landscape remains coherent.

    By keeping ISO 22400 at the center of this catalog, organizations maintain a consistent reference even as local needs evolve.

    Testing and validation against ISO 22400 definitions

    Just declaring that a KPI follows ISO 22400 is not enough; implementations should be tested against the standard’s definitions. Practical steps include:

    • Reviewing mappings from raw data to KPIs and checking that they align with the conceptual descriptions in ISO 22400.
    • Validating that time behavior (e.g., per shift, per order, per calendar period) matches what the standard anticipates.
    • Running sample calculations and comparing results across systems to ensure they agree when given the same input events.
    • Using automated tests in integration pipelines to flag unexpected changes in KPI semantics.

    Testing at the semantic level helps avoid subtle discrepancies that may only become visible after months of production use.

    Collaborating with vendors on semantic alignment

    Many MES, SCADA, and analytics vendors already expose KPIs with names that resemble ISO 22400 concepts, but implementations may vary. Collaborating with vendors can improve interoperability:

    • Request documentation of how vendor KPIs map (or do not map) to ISO 22400 definitions.
    • Ask for configuration options that make vendor-provided KPIs align more closely with the standard.
    • Share your semantic hub or KPI model so vendors understand the integration expectations.
    • Where strict alignment is not possible, agree on clear metadata indicating how vendor KPIs differ from ISO 22400 concepts.

    This cooperative approach reduces the need for brittle, ad hoc transformations in your own integration layers.

    Summary: ISO 22400 as a Foundation for Sustainable KPI Interoperability

    ISO 22400 is more than a catalog of manufacturing KPIs; it is a semantic framework that allows heterogeneous systems to describe performance in a consistent way. By standardizing names, definitions, time structures, and associated attributes for key indicators, it reduces the semantic friction that often dominates integration projects.

    In practice, using ISO 22400 as a reference means:

    • Designing integrations around a shared KPI model instead of bespoke mappings.
    • Making KPI semantics explicit in APIs and data contracts, including units, ranges, and time behavior.
    • Supporting both standardized and custom KPIs with clear metadata and governance.
    • Collaborating with vendors and partners on a common vocabulary for performance reporting.

    The standard intentionally avoids prescribing protocols, databases, or improvement strategies. It focuses on meaning. Organizations that adopt ISO 22400 as a semantic layer can simplify integration work, improve the reliability of cross-plant reporting, and create a foundation for future analytics and optimization initiatives without locking themselves into any specific technology stack.

  • KPI Governance with ISO 22400: Roles, Rules, and Routines

    KPI Governance with ISO 22400: Roles, Rules, and Routines

    ISO 22400 gives manufacturers a shared vocabulary for key performance indicators (KPIs). KPI governance decides how that vocabulary is used, who can change it, and how definitions stay consistent across plants, business units, and systems.

    This article explains how to build an ISO 22400–aligned KPI governance framework that is practical, lightweight, and transparent. The focus is on organizational practices (roles, processes, and documentation), not on any specific technology or software stack.

    Why KPI Governance Matters in Multi-Site Manufacturing

    As plants digitize and more stakeholders gain access to performance dashboards, the number of metrics can explode. Without governance, the same label may mean different things in different places, and seemingly similar metrics may be calculated differently.

    The risks of uncontrolled KPI proliferation

    • Inconsistent definitions: One site measures “availability” including setup time; another excludes it. Both report a single percentage under the same name.
    • Duplicated metrics: Slightly different formulas are introduced for similar KPIs, multiplying dashboards without improving insight.
    • Hidden assumptions: Local spreadsheets and reports embed undocumented business rules that nobody else can see or audit.
    • Integration overhead: IT teams must constantly translate between plant-specific definitions when building group reports or integrating new systems.

    Impact on decision quality and trust in numbers

    When people discover that two plants use different definitions for supposedly identical KPIs, trust erodes quickly. Common symptoms include:

    • Management running parallel analyses to “verify” reported performance.
    • Endless debates over which numbers are correct instead of what actions to take.
    • Plants resisting corporate dashboards because they do not recognize the definitions.

    A governance framework does not automatically improve performance, but it does make performance information reliable enough to support decisions.

    How ISO 22400 provides a stable vocabulary

    ISO 22400 offers a neutral, standardized language for manufacturing operations KPIs. It defines concepts such as availability, utilization, equipment states, time categories, and order-related performance in a technology-agnostic way.

    By aligning governance with the ISO 22400 manufacturing KPI definition framework, organizations can:

    • Start from published, consensus-based definitions instead of inventing everything from scratch.
    • Make data integration easier between MES, ERP, historians, and reporting tools.
    • Clarify which KPIs are standardized and which are organization-specific.

    Defining Governance Roles and Responsibilities

    Clear ownership is the foundation of KPI governance. Every KPI should have someone who is accountable for its definition, and a defined group that can propose changes.

    Central KPI owners vs. local process experts

    A practical pattern for multi-site manufacturers is to separate central ownership from local stewardship:

    • Central KPI owners (often in an operations excellence, manufacturing engineering, or business analytics function) are accountable for:
      • Maintaining the canonical definition aligned with ISO 22400 where applicable.
      • Approving or rejecting change requests.
      • Ensuring documentation stays complete and up to date.
      • Coordinating across sites when a definition change has broad impact.
    • Local process experts (plant engineers, production supervisors, maintenance leads) act as stewards who:
      • Validate whether the KPI is meaningful and applicable locally.
      • Identify issues with data availability or interpretation on the shop floor.
      • Propose refinements or additional indicators to capture local realities.

    This split keeps definitions coherent at the group level while still grounding them in operational reality.

    Involving IT, operations, and finance

    ISO 22400 KPIs touch multiple functions. A robust governance model usually involves three perspectives:

    • Operations: Ensure that the KPI reflects how production, maintenance, and quality are actually managed day to day.
    • IT / data engineering: Confirm that required data exists, can be collected reliably, and can be processed at the needed latency and granularity.
    • Finance / controlling: Align operational KPI definitions with how performance is reported at higher levels without confusing operational indicators with financial results.

    Many organizations formalize this collaboration in a cross-functional KPI steering group or data governance council that meets regularly to review requests and issues.

    Decision rights for adding or changing KPIs

    To avoid ad-hoc changes, define explicit decision rights:

    • Who can propose: Typically any plant or function can raise a request for a new KPI or a change in definition.
    • Who can recommend: A working group of subject-matter experts assesses the proposal, its ISO 22400 alignment, and technical feasibility.
    • Who can decide: Central KPI owners or a governance board approve, defer, or reject changes, considering network-wide impact.

    Documenting these rights reduces friction and ensures that no single site can unilaterally redefine a shared KPI.

    Documenting KPIs Using ISO 22400 Concepts

    Without structured documentation, governance becomes informal and dependent on tribal knowledge. ISO 22400 suggests a rich set of attributes that can be reused in your internal KPI catalog.

    Using standardized attributes and terminology

    For each KPI, capture a minimum set of attributes, reusing ISO 22400 concepts where they apply:

    • Name: A unique label, ideally reflecting ISO 22400 terminology.
    • Conceptual definition: A plain-language explanation of what the KPI measures, not just its formula.
    • Scope / object of measurement: Work unit, line, area, plant, or order, aligned with the standard’s hierarchy.
    • Domain: Production, quality, maintenance, inventory, or energy.
    • Time behavior: Whether it is real-time, per shift, daily, weekly, etc.
    • Underlying states and quantities: Which equipment states, time buckets, and material quantities feed into the KPI.
    • Unit of measure and direction: Percentage, hours, units produced, with a clear statement of whether “more is better” or “less is better.”
    • ISO 22400 linkage: References to the standardized concept (for example, “Aligned with ISO 22400 availability indicator”).
    • Data source: Systems or sensors that provide the input data.
    • Owner and stakeholders: Who is accountable for the definition and who uses it.

    Clarify the operational risk

    When the work behind KPI Governance with ISO 22400 affects quality, delivery, or compliance, teams need one place to connect evidence, decisions, and shop-floor follow-through.

    Map the risk in KPI Governance with ISO 22400

    Creating a centralized KPI catalog or dictionary

    A centralized KPI catalog (sometimes called a KPI dictionary or data catalog entry for KPIs) makes these definitions discoverable and auditable. It may be implemented as:

    • A specialized data catalog tool.
    • An internal web portal with search and filters.
    • A governed spreadsheet or database with controlled access.

    Key success factors include:

    • Assigning responsibility to keep entries current whenever dashboards or data models change.
    • Ensuring that business users can easily navigate by plant, domain, or role.
    • Linking catalog entries to report and dashboard metadata so that users can jump from a chart to its definition.

    Marking which KPIs are ISO 22400-based

    Not every KPI will or should be ISO 22400-based. To avoid confusion:

    • Tag ISO 22400-aligned KPIs explicitly in the catalog (for example, a boolean flag or a specific category).
    • Record any deviations from the standard definition, such as additional filters or modified scope.
    • Use consistent naming conventions so that standardized KPIs are easy to recognize in reports.

    This clarity helps teams distinguish between standardized, comparable KPIs and locally defined indicators designed for specialized needs.

    Change Management for KPI Definitions

    Once KPIs become embedded in reports, incentives, and supplier contracts, changing a definition can have significant consequences. ISO 22400 provides a stable foundation, but your own definitions will still evolve as operations change.

    Assessing impact of KPI changes

    Before modifying a KPI definition, governance should consider:

    • Systems affected: Which dashboards, reports, alerts, and integrations consume this KPI?
    • Stakeholders impacted: Which plants, teams, and external partners use it in their decision-making?
    • Historical comparability: Will the change break trend analysis or contractual baselines?
    • Standard alignment: Does the proposed change move the KPI closer to or further from ISO 22400 concepts?

    Simple change templates or checklists make this assessment repeatable and auditable.

    Versioning and communication practices

    To keep trust in KPIs, treat definition changes like software releases:

    • Version numbers: Assign a version to each KPI definition; increment it whenever the meaning changes, not just the visualization.
    • Effective dates: Record when the new version takes effect, so data can be interpreted correctly over time.
    • Change logs: Maintain a concise history explaining why each change was made and who approved it.
    • Communication plans: Inform affected users in advance, including what will change, why, and how to interpret trends across the change.

    Managing coexistence during transitions

    In some cases, the old and new definitions must coexist for a period. Common strategies include:

    • Dual reporting: Show both the legacy KPI and the new one on the same dashboard, clearly labeled, for a defined transition period.
    • Back-calculation where feasible: If raw data allows, compute the new definition for past periods to maintain continuous trend lines, while documenting that the series was recalculated.
    • Cutover points in reports: Mark the date when the definition changed on historical charts.

    The goal is transparency: users should never be surprised by unexplained jumps in KPI values.

    Embedding Governance into Tools and Workflows

    Governance works best when it is built into everyday tools and processes instead of relying on manual policing. While ISO 22400 is technology-agnostic, its concepts can be enforced through configuration and automation.

    Using platforms like an ISO 22400 KPI definition framework to enforce definitions

    If you use a centralized platform for manufacturing performance reporting or a dedicated KPI management tool, you can configure it around ISO 22400 concepts:

    • Define canonical formulas and scopes aligned with ISO 22400 in a single place.
    • Expose standardized KPIs as reusable building blocks for dashboards and plants.
    • Integrate the platform with your KPI catalog so that users can click through from a chart to its official definition.

    Roles-based access to KPI configuration

    Roles and permissions in reporting and analytics tools should reflect governance rules:

    • Configuration roles: Only designated owners or administrators can edit standardized KPI definitions.
    • Local extension roles: Sites can create plant-specific indicators, but must label them clearly and cannot overwrite global definitions.
    • Viewer roles: Most users consume KPIs but cannot change underlying definitions.

    This division enables local flexibility without sacrificing global consistency.

    Automated checks to prevent duplicate or conflicting KPIs

    Tools can support governance by detecting issues early:

    • Name uniqueness checks: Prevent new KPIs from using names already assigned to existing indicators.
    • Similarity checks: Flag definitions that are nearly identical to existing KPIs, prompting consolidation.
    • Metadata completeness rules: Require key attributes (unit, owner, ISO 22400 alignment flag) before a KPI can be published.
    • Approval workflows: Route new or changed KPI definitions for review before they appear in production dashboards.

    Connect decisions to execution

    Connect 981 helps turn this kind of operational detail into traceable action, so the context behind each decision does not get lost.

    Discuss the workflow for KPI Governance with ISO 22400

    Measuring the Success of KPI Governance

    Governance itself should be monitored. While ISO 22400 defines operational KPIs, you can create a small set of governance health indicators to see whether your KPI management practices are working.

    Indicators of improved comparability and trust

    Signs that governance is effective include:

    • Reduction in ad-hoc metrics: Fewer locally defined KPIs that duplicate or conflict with group standards.
    • Stable definitions: Core KPIs change infrequently and, when they do, changes are properly documented.
    • Fewer disputes over numbers: Less time spent reconciling reports across sites and more time spent on root-cause analysis and improvement ideas.
    • Simpler system integration: New plants or systems can be onboarded using existing KPI definitions with minimal translation work.

    Feedback loops from plant teams and management

    Governance should be a living process, not a one-time project. To keep it relevant:

    • Solicit regular feedback from plants on whether KPI definitions fit real-world operations.
    • Schedule periodic reviews of the KPI catalog to retire unused indicators and refine ambiguous ones.
    • Track issues raised through support channels or data-quality tickets that relate to KPI meaning or interpretation.

    When feedback results in visible improvements, engagement with governance processes tends to increase.

    Continuously evolving governance as operations change

    As manufacturing strategies, products, and technologies evolve, so will your KPIs. ISO 22400 provides a durable backbone, but your governance model should accommodate:

    • New domains (for example, energy efficiency or advanced traceability) that require additional indicators beyond the standard.
    • New data sources such as IoT sensors or advanced analytics models that enrich existing KPIs.
    • Organizational changes such as plant acquisitions or divestments that affect the set of shared KPIs.

    The aim is not to freeze KPI definitions forever, but to manage change deliberately and transparently.

    Putting It All Together

    ISO 22400 does not prescribe how to govern KPIs, but it offers a clear conceptual foundation. By combining that foundation with practical governance practices — ownership, documentation, change control, and tool support — manufacturers can create a KPI environment that is both comparable across sites and adaptable to local realities.

    A well-run governance framework will not, by itself, improve performance. What it does is ensure that leaders, engineers, and operators share a common understanding of the numbers they use to steer the business. That shared understanding is a prerequisite for meaningful, data-informed improvement across modern manufacturing networks.

    For teams putting this topic into daily operation, ISO 22400 KPI governance, a connected execution platform, Connect 981’s aerospace execution solutions help connect the concept to traceability, work-order reality, and audit-ready evidence.

    This article is for aerospace operations, quality, and compliance teams who need to understand KPI Governance with ISO 22400: Roles, Rules, and Routines. It explains the practical question this topic answers in a manufacturing execution context.

    The same operating model also depends on real aerospace execution examples, Connect 981’s aerospace operations guidance, practical aerospace operations FAQs, especially when decisions have to move across quality, production, suppliers, and program leadership without losing context.

    For teams putting this topic into daily operation, ISO 22400 KPI governance help connect the concept to traceability, work-order reality, and audit-ready evidence.

  • Integrating Non-Conformance Management With ERP and MES in Aerospace

    Integrating Non-Conformance Management With ERP and MES in Aerospace

    In aerospace manufacturing and MRO, non-conformance reports (NCRs) do not live in a vacuum. Every quality decision affects production schedules, inventory availability, cost accounting, and—ultimately—flight safety. When NCR workflows are disconnected from enterprise resource planning (ERP) and manufacturing execution systems (MES), organizations end up with blind spots, double entry, and conflicting data that erode both efficiency and compliance.

    Integrating non-conformance management with ERP and MES creates a single coherent story across work orders, inventory, and quality records. Done well, it lets teams see—within minutes—what material is affected, which operations are blocked, what the cost impact is, and when a line can restart. Done poorly, it introduces new failure modes, data inconsistencies, and audit risks.

    For teams putting erp / mes / plm interoperability into daily operation, data mapping and system interoperability, MES execution control, shop floor execution control help connect the concept to traceability, work-order reality, and audit-ready evidence.

    The same operating model also depends on ERP, MES, and PLM integration paths, quality management workflows, a connected execution platform, Connect 981’s aerospace execution solutions, especially when decisions have to move across quality, production, suppliers, and program leadership without losing context.

    This article explains how to integrate non-conformance management with ERP and MES in aerospace environments. It focuses on key data flows, typical integration scenarios, and design considerations that support reliability, traceability, and regulatory compliance.

    For a broader view of process design before you tackle integration, see our guide on integrated aerospace quality workflows.

    Why NCR Integration With ERP and MES Matters

    Aerospace organizations often start with quality-managed NCRs in a standalone system or spreadsheet. Over time, they discover that almost every disposition decision requires data held elsewhere: work order status in MES, inventory balances in ERP, contract requirements in a customer portal, and so on. Integration closes these gaps.

    Linking quality events to work orders and routings

    When an inspector raises an NCR, they usually do it in the context of a specific job: a work order, operation, or task. If your NCR system is not tied to ERP and MES, you immediately face problems:

    • Ambiguous context: NCRs reference work orders or operations via free-text fields, increasing the risk of mis-typed IDs and mislinked records.
    • Lost history: Planners and engineers viewing work orders in ERP or MES cannot see associated NCRs without separate searches.
    • Inconsistent status: A work order may look released and executable in MES even though a critical NCR is still open in the quality system.

    Integration solves this by ensuring each NCR is anchored to authoritative production data:

    • The NCR record references the exact work order, operation, operation sequence, and resource from MES/ERP.
    • Work order screens show links or badges indicating open NCRs and their dispositions.
    • Routings and travelers reflect holds or additional steps (e.g., rework operations) derived from NCR decisions.

    Accurate inventory, WIP, and cost accounting

    Every NCR disposition—rework, scrap, or use-as-is—affects quantities and costs. Without integration, these updates depend on manual re-keying into ERP, which is slow and error-prone.

    Key impacts that should be automated via integration include:

    • Inventory balances: Moving parts to quality hold, returning them to stock, scrapping them, or issuing replacements.
    • WIP (work in process): Adjusting WIP quantities when assemblies are partially scrapped or reworked.
    • Cost allocation: Capturing labor, material, and overhead associated with rework or scrap to the right cost centers, work orders, or projects.
    • Customer or contract impacts: Flagging costs that must be charged to a specific program, contract line item, or warranty account.

    With integrated systems, an approved disposition in the NCR workflow can automatically trigger the right ERP transactions—such as inventory adjustments, additional operations, or cost postings—removing the need for duplicate data entry.

    Real-time impact assessment for production planning

    Production planners, schedulers, and program managers need to answer questions such as:

    • How many assemblies are blocked by quality holds?
    • Which lines are at risk if this NCR leads to scrap instead of rework?
    • Do we have enough conforming material to meet this week’s ship dates?

    When NCR, ERP, and MES data are synchronized, planning tools can show the impact of quality events in real time:

    • Work orders and operations affected by open NCRs are clearly visible in planning boards.
    • Inventory availability calculations reflect parts under quality hold.
    • Scenario planning can incorporate potential scrap rates or extended lead times driven by rework.

    Core Data Elements Shared Across Systems

    Successful integration starts with a precise understanding of which data elements are owned by which system—and how they should be referenced in NCR workflows.

    Parts, serial numbers, and configuration baselines

    Aerospace quality decisions hinge on precise identification of parts and configurations. Typical shared elements include:

    • Part and assembly identifiers: Part numbers, revisions, and descriptions managed in ERP/PLM.
    • Serial/lot/batch numbers: Unique identifiers needed for traceability to specific aircraft, engines, or line-replaceable units.
    • Configuration baselines: Which drawing revision, bill of material (BOM), and process specification applied when the unit was built or serviced.

    From an integration standpoint, your NCR system should never maintain its own “shadow” master list of parts or serials. Instead, it should reference authoritative master data from ERP and, where applicable, PLM or configuration management systems.

    Work orders, operations, and resources

    Most NCRs relate to an execution context, which lives primarily in MES and/or ERP:

    • Work orders / shop orders: Job identifiers, quantities, due dates, and related projects or contracts.
    • Operations / tasks: Routing steps, standard work instructions, and inspection operations.
    • Resources: Machines, tools, and cells, plus the operators or technicians executing the work.

    Integrating non-conformance management with ERP and MES means NCR records can:

    • Automatically pull in the correct work order and operation when raised from an MES screen.
    • Associate resource usage (machine, fixture, tool) with the deviation to support root cause analysis.
    • Feed back rework operations or additional inspections into routings as part of approved dispositions.

    Suppliers, customers, and contracts

    External stakeholders are a critical part of aerospace non-conformance management:

    • Suppliers: Vendor IDs, purchase orders, delivery notes, and certificates of conformity.
    • Customers: Contract references, customer-specific quality clauses, and deviation permit processes.
    • Regulatory and contractual constraints: Requirements for notification, approval workflows, and retention periods.

    Quality systems must use supplier and customer master data from ERP/CRM to ensure that notifications, charge-backs, and reporting align with commercial agreements. For example, an NCR against incoming material should be directly linked to the originating PO and supplier record, not just recorded via free text.

    Typical Integration Scenarios

    Most aerospace organizations converge on a handful of common NCR–ERP–MES integration patterns. The specifics vary, but the underlying scenarios are remarkably consistent.

    Creating NCRs from ERP/MES context

    The most visible integration requirement is the ability to launch an NCR from within ERP or MES while preserving context:

    • Inspector in MES identifies a defect during an in-process check and raises an NCR against the current operation.
    • Receiver in ERP identifies a discrepancy at incoming inspection and triggers an NCR from the purchase order or receipt line.
    • Planner finds a documentation error on a work order and opens an NCR tied to that job.

    Key design choices include:

    • Single sign-on and deep links: Users click a button in MES/ERP and are taken directly to a pre-populated NCR form.
    • Pre-filled data: Work order IDs, part numbers, operations, and supplier/customer data are automatically copied from ERP/MES into the NCR.
    • Bidirectional references: The NCR stores the originating ERP/MES keys, and the ERP/MES record stores a link or reference back to the NCR.

    Applying holds and releases in inventory and WIP

    Once an NCR is raised, the organization must prevent suspect material from advancing. Integration enables this without manual phone calls or emails:

    • Inventory holds: An NCR on incoming material automatically sets the relevant lots or serials to a quality-hold status in ERP.
    • WIP holds: Open NCRs against certain work orders or operations can block movement to the next operation in MES.
    • Release logic: When an NCR is dispositioned and containment is verified, the integration can remove holds or redirect units to rework operations.

    Design considerations:

    • Define which system is the system of record for hold/release status (often ERP for stock, MES for WIP).
    • Ensure that NCR workflows cannot close without confirming that physical inventory/WIP status has been updated.
    • Provide clear visibility in ERP/MES screens when a part or job is on hold because of an NCR.

    Posting rework, scrap, and use-as-is decisions

    Disposition drives financial and operational outcomes. Integration should translate quality decisions into concrete ERP and MES transactions:

    • Rework: Create or modify operations in MES, issue additional materials, and capture labor hours against rework tasks.
    • Scrap: Post scrap transactions in ERP to remove inventory/WIP and book the cost to the appropriate account or project.
    • Use as-is / deviation: Record engineering approvals in the NCR system and, where required, update configuration or as-built records in ERP/MES.

    These postings should be as automated as practical, based on pre-defined mapping between disposition codes and ERP/MES transactions. At the same time, aerospace organizations must ensure that IT and compliance teams review any automation to verify it meets internal control requirements.

    Technical Integration Approaches

    No single integration pattern is universally correct. The right design depends on your existing architecture, vendor capabilities, regulatory expectations, and internal IT standards. Most aerospace companies mix several of the approaches below.

    APIs, middleware, and event-driven workflows

    Modern NCR, ERP, and MES platforms often expose REST or SOAP APIs and can publish or consume events. Typical choices include:

    • Direct API integrations: NCR application calls ERP/MES APIs (or vice versa) to retrieve master data and post transactions.
    • Middleware / ESB: An integration layer orchestrates data flows, transforms payloads, and centralizes error handling.
    • Event-driven architecture: Systems publish business events (e.g., “NCRCreated”, “NCRDispositioned”) to a message bus, and subscribers react by updating their own data stores.

    Event-driven designs can reduce coupling and improve scalability but require robust monitoring and governance to avoid silent failures.

    Data mapping and master data management

    Technical plumbing alone is not enough. You must define consistent semantics across systems:

    • Standardized codes for dispositions, defect types, causes, and corrective actions.
    • Common identifiers for parts, customers, suppliers, and resources.
    • Clear ownership rules for who can create or change master data and how those changes propagate.

    Master data management (MDM) practices help here. Whether you use a dedicated MDM tool or governance processes around ERP, the goal is to ensure that all systems refer to the same business objects in the same way.

    Handling offline and multi-site environments

    Aerospace operations often span multiple plants, test facilities, and field locations—some with intermittent connectivity. Integration designs should account for:

    • Local capture: Ability to record NCRs offline on tablets or local systems, then synchronize when connectivity is restored.
    • Latency-aware behavior: Clear rules about what actions can proceed without immediate confirmation from ERP/MES (e.g., temporary local holds vs. enterprise-wide stock status changes).
    • Site-specific variations: Different ERPs or MES instances at different plants, with a central quality system or vice versa.

    For multi-site environments, consider patterns such as hub-and-spoke integration, regional middleware instances, or phased rollouts that allow each site to stabilize before expanding the footprint.

    Designing for Reliability and Traceability

    In aerospace, an integration that “usually” works is not good enough. Systems must support rigorous traceability, predictable behavior under failure, and clear audit trails.

    Error handling and reconciliation

    Integration errors will occur: network timeouts, data validation failures, or mismatched identifiers. Designing for reliability means:

    • Idempotent operations: Replaying integration messages without creating duplicate transactions.
    • Queued retries: Automatic retries for transient failures with backoff policies.
    • Dead-letter handling: A controlled queue or worklist for messages that cannot be processed automatically.
    • Reconciliation reports: Periodic checks comparing key fields (e.g., hold statuses, scrap quantities) across systems to detect drifts.

    Audit trails across system boundaries

    Regulators and customers expect you to prove not only what decisions were made, but also how those decisions flowed through your systems. Practical measures include:

    • Storing correlation IDs that link NCR records to ERP/MES transactions.
    • Logging which integration process invoked which API, with timestamps and outcomes.
    • Ensuring that any automated changes (e.g., inventory status updates from an NCR decision) are traceable to the originating NCR and user.

    These capabilities simplify audits by showing a clear, end-to-end chain from defect discovery through disposition, execution, and financial posting.

    Change management and regression testing

    As processes, systems, and regulations evolve, integrations must change. Before deploying modifications:

    • Use representative test data that includes critical cases (serialized parts, safety-critical items, customer-specific rules).
    • Run end-to-end regression tests that validate not just data movement but also business outcomes (e.g., holds applied, costs posted correctly).
    • Involve quality, production, finance, and compliance stakeholders in sign-off.

    IT and compliance teams should jointly agree on the level of validation required for each type of integration change, especially where it may impact regulatory evidence or financial postings.

    Governance and Continuous Improvement

    NCR–ERP–MES integration is not a one-time project. As product lines, suppliers, customers, and regulations change, so do integration requirements. Governance keeps the solution aligned with the business.

    Defining ownership for integrated processes

    Clarify who owns what:

    • Process ownership: Quality leaders define how NCR workflows should behave and what data they require.
    • System ownership: IT or application owners manage the configuration and technical integrity of ERP, MES, and quality systems.
    • Integration ownership: An integration architect or team maintains the contracts, data mappings, and monitoring around cross-system flows.

    Having named owners makes it easier to resolve issues, prioritize enhancement requests, and manage change.

    Monitoring data quality and integration KPIs

    Beyond technical uptime, monitor indicators that reveal whether integrated processes actually work for the business. Examples include:

    • Percentage of NCRs created from ERP/MES context versus manual entry.
    • Frequency of mismatches between NCR dispositions and ERP inventory or cost data.
    • Number of integration-related incidents discovered during audits.
    • Mean time to apply holds in ERP/MES after NCR creation.

    These metrics help you identify where integrations need refinement or additional training.

    Iterating integration as business needs evolve

    As you mature, you may:

    • Extend integration to new plants or maintenance depots.
    • Incorporate additional systems (e.g., PLM, supplier portals, or field service tools).
    • Automate more of the NCR lifecycle where risk and internal controls allow.

    Approach this as a continuous improvement program, not a one-time rollout. Regularly revisit your integration design in light of new customer requirements, regulatory interpretations, and internal lessons learned.

    Putting It All Together

    Integrating non-conformance management with ERP and MES is a cornerstone of modern aerospace quality operations. By anchoring NCRs to production, inventory, and financial data, organizations can:

    • Reduce manual data entry and associated errors.
    • Provide real-time visibility into the impact of quality issues.
    • Strengthen traceability from defect detection through disposition and execution.
    • Improve readiness for regulatory and customer audits.

    There is no single blueprint that fits every aerospace organization. The right integration architecture depends on your current systems, regulatory posture, and risk tolerance. What matters most is that IT, quality, production, and finance jointly define how data should flow, validate the design against compliance requirements, and treat integration as a living capability that evolves with the business.

  • Supplier Work Order Coordination in the Aerospace Supply Chain

    Supplier Work Order Coordination in the Aerospace Supply Chain

    When supplier work orders are invisible, on-time delivery becomes guesswork

    Aerospace manufacturers depend on a wide network of suppliers and sub-tiers. Critical components, special processes, and repair activities often happen outside your own walls. Yet in many organizations, supplier work orders become effectively invisible once a purchase order is issued. That is not just a visibility problem. It is an on-time delivery problem.

    This article is for aerospace operations, quality, and compliance teams who need to understand Supplier Work Order Coordination in the Aerospace Supply Chain. It explains the practical question this topic answers in a manufacturing execution context.

    Supplier OTD and Client OTD are two of the most important KPIs in aerospace. Supplier OTD determines whether parts arrive when planned. Client OTD determines whether you deliver aircraft, assemblies, or serviceable assets on schedule. The hard reality is that these KPIs are linked across tiers. When a supplier loses days acknowledging an order, clarifying requirements, or resolving documentation gaps, that delay flows downstream. Your internal schedule compresses, expedites increase, and delivery risk rises.

    For teams putting this topic into daily operation, supplier and supply chain coordination, supply chain and supplier execution, shop floor execution control help connect the concept to traceability, work-order reality, and audit-ready evidence.

    The same operating model also depends on a connected execution platform, Connect 981’s aerospace execution solutions, real aerospace execution examples, Connect 981’s aerospace operations guidance, especially when decisions have to move across quality, production, suppliers, and program leadership without losing context.

    If you manage supplier execution by PDF and email, you are managing OTD by feel rather than by evidence.

    The typical pattern looks like this. ERP issues a PO. A PDF of requirements or a drawing set is attached. The supplier converts those requirements into their own internal work orders and instructions. Weeks later, parts arrive with a packet of certificates and inspection records. If something is late, incomplete, or out of tolerance, you discover it at the receiving dock or later in the build. By then, the schedule impact is already real.

    This disconnect affects more than delivery dates. It weakens traceability. It complicates non-conformance investigation. It leaves program managers guessing how supplier issues will affect complex builds. The internal work order management discipline you may have built does not extend to the external work that your products depend on.

    Clarify the operational risk

    When the work behind Supplier Work Order Coordination in affects quality, delivery, or compliance, teams need one place to connect evidence, decisions, and shop-floor follow-through.

    Map the risk in Supplier Work Order Coordination in

    Why supplier portals matter for OTD, not just documentation

    Many people hear “supplier portal” and think of a place to upload documents. That is part of it, but the real operational value is faster acknowledgement, clearer execution alignment, and tighter exception handling. Those three directly improve Supplier OTD, and when Supplier OTD improves, Client OTD becomes easier to protect.

    A supplier portal supports OTD in practical ways:

    • Faster order acknowledgement: suppliers can confirm receipt, accept or reject dates, and flag constraints immediately, instead of waiting on email chains.
    • Reduced clarification cycles: requirements, drawings, and inspection expectations are shared in a controlled way, which reduces back and forth and rework.
    • Earlier exception detection: if a supplier hits a hold, material delay, or capacity issue, it becomes visible while recovery options still exist.
    • Shorter administrative latency: certificates, inspection results, and required evidence are submitted in the right context, reducing receiving delays and MRB churn.

    In practice, this means fewer surprises and fewer compressed schedules. It also means more predictable lead times. Predictable lead times are what allow manufacturers to take on more work, commit to tighter delivery windows, and win additional contracts.

    Why traditional supplier portals still fall short

    Basic supplier portals help with communication, but many do not touch how the supplier actually executes the work. Suppliers log in to acknowledge orders, provide promised dates, and upload documentation. That helps, but it is still shallow if the portal cannot represent execution status and quality evidence in a way that connects to your internal workflows.

    Common limitations include:

    • No visibility into the supplier’s routing, work instructions, or inspection points for critical work.
    • No way to see partial completion or in-process holds, only final delivery status.
    • Documentation uploads that do not tie directly to specific operations, serial numbers, or traceability requirements.
    • Separate systems for quality complaints and non-conformances, disconnected from the original work order context.

    In this setup, the supplier sees the PO and high-level requirements. You see promised dates and final documents. The shared understanding of how the work is progressing remains limited, which makes it harder to improve Supplier OTD in a durable way.

    Increase Supplier OTD by connecting orders to execution and exceptions

    On-time delivery is not only about date promises. It is about what happens between order release and shipment. The biggest OTD losses often come from slow acknowledgement, unclear requirements, and late discovery of exceptions.

    1) Acknowledgement speed is the first controllable lever

    Order acknowledgement sounds administrative, but it has real schedule impact. If a supplier takes days to confirm receipt, confirm feasibility, or request clarification, you lose schedule before work even starts. A supplier portal that supports rapid acknowledgement and structured questions reduces that latency. It also gives you early signals when dates need to move, which allows program teams to plan rather than react.

    2) In-process visibility prevents late surprises

    Most suppliers do not miss dates because they are careless. They miss dates because exceptions occur, and those exceptions are discovered late by the customer. A controlled supplier portal can surface in-process holds and blockers, including material shortages, tooling constraints, special process queue delays, and inspection failures. That creates recovery options. You can resequence internal work, expedite where it matters, or rebalance load across suppliers.

    3) Documentation readiness affects receiving timelines and downstream OTD

    Even when parts arrive “on time,” they can still miss the real schedule if certificates or inspection evidence are incomplete. Receiving delays, MRB holds, and document chases create hidden lead time. A portal that ties documentation submission to the correct part, operation, and traceability requirement reduces this friction.

    Traceability and non-conformance are not separate from OTD

    Traceability issues and non-conformance issues are schedule issues. When the evidence chain is incomplete, work stops. When inspection data is missing, acceptance is delayed. When a defect is discovered late, the impact expands. Supplier collaboration improves when the portal supports both delivery coordination and quality control alignment.

    That includes:

    • Submitting certificates and inspection results in context, tied to serial numbers and required characteristics.
    • Flagging potential issues early, before shipment, instead of letting the customer discover them at receiving.
    • Coordinating non-conformance workflows so containment and corrective action are visible across organizations.

    Connect decisions to execution

    Connect 981 helps turn this kind of operational detail into traceable action, so the context behind each decision does not get lost.

    Discuss the workflow for Supplier Work Order Coordination in

    This is where supplier portal workflows connect directly to quality control and the NCR process. If an issue is found, it should be handled with a closed loop that ties back to the execution record, as described in non-conformance management.

    Extend work order concepts across organizational boundaries

    The alternative to email and PDFs is to treat external work with the same discipline you expect internally. A component or process performed by a supplier should be referenced by a specific work order in your system, not just by a purchase order line. That is what allows you to connect progress, exceptions, and evidence to the schedule you are accountable for.

    In practice, that means:

    • Creating external work orders in your operations layer for supplier activities, with routing, quality requirements, and traceability rules defined.
    • Allowing suppliers to see and interact with these work orders through a controlled interface, instead of sending static packets.
    • Receiving in-process status, inspection results, and documentation against those work orders, not as disconnected uploads.

    This approach does not require imposing your entire internal system on suppliers. It requires providing a structured way for them to align execution with the work order level expectations that drive compliance, quality, and on-time delivery.

    Supplier portal workflows in Connect 981

    Connect 981 supports supplier collaboration through a portal model that extends its unified operations layer to selected suppliers and sub-tiers. Internal teams manage external work using the same structural concepts as internal routing and controlled instructions, adapted to the level of detail appropriate for each supplier. The goal is shared visibility and faster coordination, not forcing a heavy MES deployment on partners.

    Capabilities include:

    • External work orders that link POs, parts, and processing steps: visible to both parties, reducing ambiguity and clarification cycles.
    • Faster acknowledgement and structured communication: suppliers can confirm dates, flag constraints, and request clarifications early.
    • In-process status updates: supplier progress and holds feed into your internal scheduling and planning workflows.
    • Structured capture of inspection data and certificates: tied to operations and serial numbers, improving traceability and reducing receiving delays.
    • Coordinated exception handling: issues are surfaced early, so recovery actions can protect Supplier OTD and Client OTD.

    Connect 981 can also bridge the system boundaries that usually slow this down, especially when ERP and MES do not share consistent execution data. That integration path is covered in integrating work orders with ERP and MES.

    Traceability that spans the full supply chain

    For regulators and prime customers, traceability does not stop at your receiving dock. They expect to see how critical characteristics were controlled across the value chain. When external work orders are coordinated through a supplier portal workflow, that traceability becomes easier to provide and easier to trust.

    For a given aircraft structure or system, you can show:

    • Which internal and external work orders contributed to each serialized component.
    • Which suppliers and sub-tiers performed special processes or repairs.
    • Which inspection results and certificates are tied to each operation, not just to the shipment.
    • How non-conformances were identified, contained, and corrected across organizations.

    This level of transparency reduces time spent on audits and investigations. It also improves day to day decision making. When a supplier issue emerges, you can quickly identify the internal work orders and assemblies that may be affected, then act with precision instead of broad, costly holds.

    Supporting suppliers rather than policing them

    Supplier performance is shaped by the clarity and practicality of the requirements they receive. A supplier portal model based on shared work order visibility is not about surveillance. It is about reducing ambiguity and rework for both sides, which improves both Supplier OTD and Client OTD.

    Suppliers benefit from:

    • Clear visibility into required checkpoints and documentation before work starts.
    • Fewer last-minute changes sent by email, since configuration control is handled through the same platform.
    • Faster feedback on submitted documentation and inspection evidence.
    • Less friction during audits, since records are organized by work order and operation.

    Manufacturers benefit from fewer surprises, better alignment on lead times, and fewer cycles spent reconciling documentation gaps. Over time, this reliability is what creates capacity to take on more contracts and deliver more consistently.

    Taking the next step in Supplier OTD and Client OTD performance

    Many aerospace organizations have strengthened internal execution and quality control, but still run supplier coordination through email, PDFs, and late status updates. Extending work order discipline to the supply chain is the next logical step. It closes visibility gaps and accelerates decision making across tiers.

    Connect 981 was built with this in mind. By using Connect 981 as a supplier portal and shared operations layer for selected suppliers, you can align routing, quality expectations, and status updates without forcing a heavy system on partners. The outcome is a supply chain that operates on shared evidence rather than assumptions, which is exactly what OTD improvement requires.

    If you want to see how supplier portal workflows can improve Supplier OTD and Client OTD in your environment, request a demo of Connect 981 and explore how a unified operations layer can accelerate execution across your aerospace supply chain.

  • Applying ISO 22400 in Aerospace and MRO: KPI Use Cases and Patterns

    Applying ISO 22400 in Aerospace and MRO: KPI Use Cases and Patterns

    ISO 22400 defines a common language for manufacturing KPIs. Aerospace manufacturing and Maintenance, Repair, and Overhaul (MRO) environments operate under intense regulatory, safety, and traceability pressures, but they still benefit from standardized KPI terminology. Applying ISO 22400 here is less about inventing new aerospace metrics and more about mapping existing practices to clearly defined concepts that work across plants, partners, and digital systems.

    This article explains where ISO 22400 fits in aerospace and MRO, shows practical KPI use cases, and highlights how to combine standard definitions with sector-specific indicators such as turnaround time and traceability. It focuses on patterns and examples, not on prescribing a single KPI set or giving performance-improvement advice.

    For teams putting traceability and genealogy into daily operation, MES execution control, part genealogy and traceability, part traceability and as-built evidence help connect the concept to traceability, work-order reality, and audit-ready evidence.

    The same operating model also depends on MRO execution workflows, shop floor execution control, a connected execution platform, Connect 981’s aerospace execution solutions, especially when decisions have to move across quality, production, suppliers, and program leadership without losing context.

    For a broader view of the standard itself and how it structures manufacturing KPIs across industries, see our overview of ISO 22400-aligned aerospace and MRO reporting.

    Aerospace and MRO KPI Challenges

    Aerospace and MRO organizations already report on utilization, schedule adherence, quality, and resource consumption. The difficulty is ensuring that metrics mean the same thing across facilities, programs, and suppliers, and that they remain auditable over long time horizons.

    High stakes for safety, traceability, and compliance

    In aerospace and MRO, metrics underpin decisions that affect airworthiness and regulatory compliance. Authorities and customers expect clear evidence for how aircraft, components, and maintenance activities were planned, executed, and released.

    • Safety and airworthiness: KPIs around maintenance execution, inspection findings, rework, and release status must be tightly linked to configuration and documentation baselines.
    • Traceability: Every part, task, and sign-off may need to be traced across multiple systems (PLM, ERP, MES/MRO, QMS). KPIs built on ambiguous definitions of time or quantity risk undermining that traceability.
    • Compliance: Regulators focus on whether records are complete, consistent, and understandable. KPI definitions that change from site to site can create gaps during audits.

    ISO 22400 does not define aerospace regulations. Instead, it offers standardized KPI concepts (for example, equipment utilization or order execution reliability) that can be aligned with regulated processes and record sets.

    Complex routings, configurations, and rework

    Aerospace manufacturing and MRO environments handle complex assemblies, long routings, and frequent engineering changes. Maintenance events, in particular, often deviate from plan as findings drive additional scope.

    • Non-linear work: Jobs may move backward in the routing because of rework, waiting for parts, or additional inspections, complicating lead time and utilization calculation.
    • Configuration variation: The same work center may handle multiple aircraft types, modification standards, or customer-specific configurations.
    • Extended dwell times: Aircraft or large assemblies may spend days or weeks at a given station while multiple work packages proceed in parallel.

    ISO 22400’s neutral definitions of time categories, equipment states, and order-related KPIs help bring structure to this complexity without prescribing aerospace-specific routing logic.

    Multi-party collaboration across OEMs, MROs, and suppliers

    Programs typically involve OEMs, tiered suppliers, independent MROs, and airline or operator maintenance teams. Each organization may use different systems, but they must still align on what reported metrics mean.

    • Supplier performance reporting: Contracts often reference utilization, turnaround, or defect-related indicators. Unclear definitions can create disputes.
    • Shared assets: Test cells, ground support equipment, and specialized tooling may be used by multiple organizations or sites.
    • Joint improvement initiatives: Cross-company projects need comparable KPIs to identify bottlenecks or validate improvements.

    Using ISO 22400 as a reference vocabulary helps align KPIs across organizations, even when each party uses its own software stack and industry-specific metrics.

    Where ISO 22400 Fits in Aerospace and MRO

    ISO 22400 is an industry-neutral standard for manufacturing operations KPIs. Aerospace and MRO organizations can adopt its concepts selectively, focusing on the KPIs that best match their production and maintenance workflows.

    Aligning core production and maintenance KPIs

    Many aerospace and MRO metrics correspond directly to ISO 22400 KPI families, even if they currently use different names. Examples include:

    • Equipment-oriented KPIs: Utilization of test cells, paint booths, autoclaves, and ground support equipment.
    • Order-related KPIs: Adherence of maintenance events, work orders, or modification campaigns to planned time structures.
    • Resource-related KPIs: Labor hours consumed versus planned, or material usage tied to specific operations.

    Mapping these to ISO 22400 terminology improves clarity. For instance, a site that reports the percentage of planned time that a test cell is actually operating can align that metric with the standard’s definitions of equipment utilization rather than inventing a facility-specific term.

    Using standardized definitions in supplier agreements

    Supplier and MRO contracts often specify KPI-based service levels. ISO 22400 can provide unambiguous KPI descriptions in these agreements:

    • Referencing an ISO 22400-aligned definition of a utilization or availability indicator when discussing asset access or readiness.
    • Using order execution-related KPIs for agreed reporting on maintenance event adherence to plan.
    • Defining units of measure, trend directions, and time behaviors consistently, so monthly dashboards reflect the same logic at every site.

    This approach does not turn ISO 22400 into a regulatory requirement; it simply reduces interpretation risk when multiple parties reference the same concept.

    Supporting cross-site performance comparisons

    Large aerospace OEMs and MRO networks often operate multiple facilities globally. Even when each site follows local regulations and customer requirements, leadership still wants to compare performance.

    • Consistent KPI semantics: Sites can continue using local dashboards, but the underlying KPI definitions are harmonized with ISO 22400 where possible.
    • Comparable time categories: Planned, unplanned, and idle time categories follow consistent meaning, so utilization and order execution reliability can be aggregated.
    • Neutral layer across verticals: Organizations that serve aerospace plus other sectors (for example, industrial gas turbine service) can use ISO 22400 as a common baseline while layering sector-specific metrics on top.

    Example Use Cases of ISO 22400-Aligned KPIs

    The following examples illustrate how ISO 22400 concepts can be applied to aerospace and MRO scenarios. They are patterns, not prescriptions, and they do not expand the standard’s formal KPI list.

    Equipment utilization for critical ground support assets

    Ground support equipment (GSE) such as engine test cells, jacks, docking systems, hoists, and specialized tooling are high-value, capacity-limiting assets. Under- or over-utilization affects both cost and schedule.

    ISO 22400 defines equipment-related KPIs based on time categories and equipment states. When applied to GSE:

    • State definition: RUN, IDLE, STOP, or other states can be mapped to the real behavior of test stands and docking systems.
    • Time allocation: Planned versus unplanned downtime, setup time, and active operation periods are clarified.
    • Utilization indicator: A utilization KPI can be defined as the ratio of actual productive time to a defined planned time window, aligned with ISO 22400 terminology.

    This yields a consistent measure of how intensively GSE is used across shops and sites, even if their schedules and aircraft mixes differ.

    Order execution reliability for maintenance events

    Maintenance events—such as C-checks, heavy checks, or modification campaigns—can be viewed as production orders in ISO 22400 terms. The standard’s order-related KPIs provide a structured way to describe how these events progress versus plan.

    • Planned time structure: The event has a planned start, planned finish, and possibly intermediate milestones.
    • Actual execution: Actual times are captured from MRO execution systems, including delays due to findings, parts, or engineering clarifications.
    • Order execution reliability: ISO 22400-aligned KPIs can describe how closely execution followed the planned time structure or quantity profile.

    These indicators do not replace aerospace-specific turnaround or on-time-release metrics. Instead, they provide neutral, comparable views of schedule adherence and execution variability that can be used for internal analysis or supplier reporting.

    Resource-related KPIs for labor and parts usage

    Labor hours and parts consumption are central to aerospace and MRO economics. ISO 22400’s resource-related KPI concepts allow these to be linked consistently to orders, equipment, and time periods.

    • Labor indicators: Personnel-related KPIs can express, for example, total maintenance labor hours associated with a work order or area over a given shift.
    • Material indicators: Material consumption KPIs can associate parts usage with specific operations or events, supporting cost and reliability analysis.
    • Energy indicators: Energy usage for large assets (such as engine test cells or autoclaves) can be treated as a resource KPI aligned to specific orders.

    Aligning resource-related KPIs with ISO 22400 terms helps ensure that, when labor or material intensities are compared between facilities, they rest on a shared conceptual basis.

    Combining ISO 22400 with Aerospace-Specific Metrics

    Aerospace and MRO teams need KPIs that go beyond the neutral scope of ISO 22400. The goal is not to force all metrics into the standard, but to clearly distinguish which indicators are ISO 22400-based and which are aerospace-specific.

    Turnaround time breakdowns and on-time release

    Turnaround time (TAT) and on-time release are central to MRO performance. These KPIs typically combine:

    • Total elapsed time between arrival and release.
    • Breakdowns by phase (induction, disassembly, inspection, repair, reassembly, test, closing).
    • Customer- or contract-specific commitments for on-time delivery.

    These composite metrics are not defined in ISO 22400. However, many of their building blocks—such as time in particular states or adherence to planned time structures—map well to ISO 22400 time and order-related concepts. Organizations can:

    • Use ISO 22400-aligned KPIs at the level of work centers, operations, and equipment.
    • Construct TAT and on-time-release metrics on top, labeled clearly as aerospace-specific.

    Regulatory auditability and record linkage

    Regulators and customers focus on whether maintenance and manufacturing records are complete and coherent. KPI design must support this auditability.

    • Transparent definitions: ISO 22400 encourages specifying units, applicable time behaviors, and trend directions. This documentation is useful during audits, even when the KPI itself is not required by regulation.
    • Stable semantics: Once a KPI definition is agreed, changes are versioned and recorded, so historic reports remain interpretable.
    • Linkages to records: KPIs reference underlying events, logs, and approvals stored in PLM, ERP, MES/MRO, and QMS systems.

    By grounding KPIs in ISO 22400 concepts, teams can more easily show how high-level indicators relate to the detailed records that auditors and airworthiness authorities examine.

    Integrating traceability indicators with standardized KPIs

    Aerospace traceability indicators—such as the percentage of parts with complete back-to-birth records or the number of tasks with missing sign-offs—are typically sector-specific. They sit alongside standard KPIs rather than inside ISO 22400’s formal list.

    One effective pattern is:

    • Use ISO 22400-aligned KPIs for time, quantity, and resource aspects of operations.
    • Define separate traceability indicators that reference the same orders, equipment, and time periods.
    • Ensure dashboards show clearly which indicators are ISO 22400-based and which are internal, aerospace-specific constructs.

    Digital Platforms and Integration in Aerospace and MRO

    Aerospace and MRO operations rely on multiple tightly integrated systems. ISO 22400 offers a conceptual model that digital platforms can use to keep KPI definitions consistent across this ecosystem.

    How platforms like the ISO 22400 manufacturing KPIs hub map ISO 22400 concepts

    Digital operations platforms that support ISO 22400 concepts typically:

    • Model equipment, work centers, and work units using definitions compatible with IEC 62264 and ISO 22400.
    • Translate raw events (for example, equipment state changes) into standardized time categories.
    • Provide libraries of ISO 22400-aligned KPIs that customers can adopt or extend.

    Aerospace and MRO users can then layer domain-specific workflows—such as digital work instructions, airworthiness releases, and findings management—on top of a shared KPI foundation.

    Connecting PLM, ERP, MES, and QMS in regulated environments

    In a regulated aerospace environment, systems are often validated and tightly controlled. ISO 22400 does not impose a particular architecture, but it helps with integration design:

    • PLM: Defines product structures, configurations, and approved repairs or modifications that may influence how KPIs are segmented.
    • ERP: Manages orders, contracts, and financial views that align with order-related KPI hierarchies.
    • MES/MRO systems: Track execution states at work centers and operations, providing the raw events and quantities underlying KPIs.
    • QMS: Holds nonconformance, concession, and corrective action data that can be correlated with performance metrics.

    By agreeing on ISO 22400-based KPI semantics, integration interfaces can exchange performance information without redefining basic concepts every time a new connection is built.

    Ensuring KPI definitions remain transparent and auditable

    Given the long service life of many aerospace platforms, KPIs must remain interpretable for years. Digital platforms can support this by:

    • Storing KPI definitions, including mappings to ISO 22400 concepts, as configuration items with version history.
    • Documenting any extensions or sector-specific metrics separately from the standard-aligned set.
    • Providing drill-down from aggregated KPI values to underlying events, orders, and records.

    This level of transparency is useful for internal reviews and external audits alike.

    Practical Adoption Tips for Aerospace and MRO Teams

    Adopting ISO 22400 in aerospace and MRO is a matter of careful alignment and communication rather than wholesale replacement of existing KPIs.

    Engaging quality and regulatory stakeholders early

    Because KPIs feed into audit trails and, in some cases, into regulated reports, quality and regulatory teams should participate from the beginning.

    • Review ISO 22400 concepts jointly with operations and IT, focusing on how they map to current metrics.
    • Identify any constraints arising from regulations, customer contracts, or approvals that affect KPI changes.
    • Agree on how KPI definitions will be documented, controlled, and communicated to auditors and customers.

    Documenting which KPIs are ISO 22400-based and which are not

    Clarity about scope is essential. A straightforward approach is to classify indicators into two groups:

    • ISO 22400-aligned KPIs: Indicators whose names, meanings, time behaviors, and measurement objects match the standard’s conceptual definitions.
    • Aerospace-specific metrics: Composite indicators such as TAT breakdowns, traceability scores, or customer-specific service-level metrics that extend beyond the standard.

    Labeling dashboards and reports accordingly prevents confusion and avoids implying that all aerospace metrics are part of ISO 22400.

    Building a roadmap for harmonized KPI reporting

    Most organizations will evolve toward ISO 22400 adoption rather than switching everything at once. A practical roadmap often includes:

    1. Inventory: Catalog existing KPIs used in manufacturing and MRO operations.
    2. Mapping: Identify which existing metrics correspond closely to ISO 22400 concepts and where gaps or differences exist.
    3. Pilots: Harmonize a small set of high-value KPIs across two or three facilities.
    4. Governance: Establish a change-control process for KPI definitions, including representation from operations, IT, quality, and regulatory teams.
    5. Rollout: Extend harmonized definitions to more sites, suppliers, and dashboards as systems and contracts are updated.

    Throughout this journey, the objective is not to eliminate aerospace-specific metrics but to ensure that, where ISO 22400 concepts apply, they are used consistently.

    Conclusion

    ISO 22400 does not tell aerospace and MRO organizations which KPIs to use or how to meet regulatory requirements. Its value lies in establishing a shared vocabulary and structure for core manufacturing and maintenance indicators. By aligning equipment, order, and resource-related KPIs with ISO 22400, aerospace manufacturers and MRO providers can make their reporting more comparable, auditable, and integration-friendly—while continuing to use sector-specific metrics such as turnaround time, traceability indicators, and on-time release.

    Using ISO 22400 as a neutral foundation, organizations can connect PLM, ERP, MES/MRO, and QMS data into coherent performance views that serve both operational decision-makers and external stakeholders, without constraining their strategic choices or domain-specific KPI designs.