Aerospace programs generate enormous volumes of data across design, manufacturing, suppliers, and maintenance. The challenge is not data creation but data connection. A digital thread in aerospace serves as the relational backbone that links requirements to design decisions, design decisions to production records, production records to certifications, and certifications to decades of in-service maintenance. Without this connected chain, traceability breaks down exactly where it matters most.
Recent incidents have made the consequences of fragmented data painfully clear. The January 2024 Alaska Airlines Flight 1282 Boeing 737 MAX 9 door plug blowout, caused by missing bolts and improper installation during manufacturing, exposed gaps in assembly traceability between Spirit AeroSystems and Boeing’s Renton facility. That same year, the Boeing titanium quality documentation scandal revealed falsified records for titanium alloys affecting 787 and potentially 777 aircraft. Both cases illustrate what happens when production data remains siloed: the ability to trace what happened, when, and by whom disappears when it is needed most.
This article is a pillar page focused on the aerospace digital thread as the backbone of traceability systems in aerospace manufacturing. It connects to supporting articles on part traceability, lot tracking, supplier traceability, audit trail systems, data normalization, and serial number traceability. Connect981 serves as a unified operations layer that turns fragmented data into a usable digital thread, linking ERP, PLM, MES, and QMS systems down to the shopfloor and across suppliers.
- What a digital thread actually is and how it differs from digital twins and traditional PLM systems
- How digital threads support regulatory compliance across FAA, EASA, AS9100, NADCAP, and ITAR
- Building a digital thread across the full aerospace product lifecycle
- Extending traceability to suppliers and MRO operations
- Practical implementation approaches for existing operations
What Is a Digital Thread in Aerospace Manufacturing?
A digital thread in aerospace is a continuous, linked data record that flows from initial requirements and CAD/PLM through production, certification, operation, and MRO. Industry bodies like CIMdata and Eurostep define it as a communication framework that establishes a connected data flow and integrated view of product data from inception through maintenance, with automated linkages and traceability that enable reusable data flowing both downstream and upstream via feedback loops.
The aerospace industry requires this level of connectivity because products like commercial airliners and defense systems span mechanical, electrical, software, and firmware domains. A digital thread creates the meaningful relationship connections between a product’s digital assets that INCOSE describes as essential for complex systems.
- Digital thread vs. digital twin: A digital twin is a real-time virtual model simulating physical assets. A digital thread is the relational backbone connecting multiple twins and data sources without necessarily requiring simulation capabilities.
- Digital thread vs. traditional PLM/MES: Legacy systems store data but lack the dynamic, cross-system relationships that a digital thread enforces. A digital thread links systems rather than replacing them.
- Concrete example: Linking DO-178C software requirements (airborne software safety assurance) to DO-254 hardware design assurance, NC machining programs, AS9102 First Article Inspection records, and in-service maintenance logs ensures that changes in one domain propagate with full context.
- Traceability underpinning: The digital thread supports part-level, lot-level, supplier-level, and serial number traceability concepts covered in supporting articles.

How the Digital Thread Supports Aerospace Traceability and Compliance
The digital thread becomes the backbone of traceability required by FAA, EASA, AS9100D, EASA Part 21, NADCAP, ITAR, and defense regulations like MIL-STD-882. These regulatory requirements demand complete traceability from design intent through production execution to in-service maintenance. Manual approaches and disconnected systems cannot sustain this level of evidence.
A properly implemented digital thread chains requirements to evidence across the entire manufacturing process: initial specifications in PLM flow to work orders in ERP/MES, connect to inspections via digital travelers, link to certifications like Certificates of Conformance, and tie into MRO logs. This chain enables audits in hours rather than weeks by providing time-stamped event histories of who performed what action with which revision.
The 2024 Boeing titanium documentation review illustrates why this matters. Falsified records for titanium alloys from a supplier highlighted how fragmented supplier data, including missing heat lot certifications and process parameters, necessitates a digital thread to normalize identifiers like batch numbers and provide instant retrieval of full provenance chains. FAA Airworthiness Directives now mandate serial and batch identification for affected components, making this traceability critical for ensuring compliance.
Connect981 can sit between PLM, ERP, MES, and QMS systems and the shopfloor to maintain a consistent traceability chain without forcing a full system replacement. The platform acts as a unified operations layer that preserves existing investments while ensuring seamless integration across data sources.
- Instant retrieval of full build histories tied to specific serial numbers and lot numbers
- Material certifications linked to process parameters and operator sign-offs
- Nonconformance records with complete disposition trails
- Audit-ready reports generated in minutes rather than weeks
- Regulatory compliance evidence organized by program, part, or supplier
- Defense regulations compliance through ITAR-segregated data handling
Building a Digital Thread Across the Aerospace Product Lifecycle
The digital thread captures and links specific artifacts phase by phase across the aerospace product lifecycle. Each phase produces data that must connect forward to downstream operations and backward to upstream design intent.
Concept and Requirements
DO-178C and DO-254 objectives form the baseline data. Requirements management systems capture initial specifications that will need to trace forward through design, production, and certification. This phase establishes the foundation for maintaining comprehensive records throughout the product’s life.
Design and Certification Preparation
CAD/PLM revisions embed model-based definitions for geometric dimensioning and tolerancing. PLM systems like Siemens Teamcenter or Dassault 3DEXPERIENCE maintain revision control while linking design data to certification requirements. Engineering teams establish the configuration baselines that production must execute against.
Manufacturing and Assembly
This phase integrates process plans, routing sheets, build travelers, torque logs, non-destructive testing reports, and Material Review Board dispositions. AS9102 FAI ballooning drawings are digitally signed and linked to serial numbers for part-level traceability. Production processes generate the evidence that proves design intent was executed correctly.
- Routing sheets linked to specific work order numbers
- Build travelers capturing real-time operator actions and inspections
- Heat lot certifications tied to raw materials entering production
- Torque logs with calibrated tool serial numbers
- NDT reports linked to component serial numbers
- MRB dispositions with full deviation approval chains
Delivery and Operation
Acceptance test procedure results transition to operations where configuration management tracks service bulletins and Airworthiness Directives. The digital thread maintains the link between as-built and as-delivered configurations.
Maintenance, Repair, and Overhaul
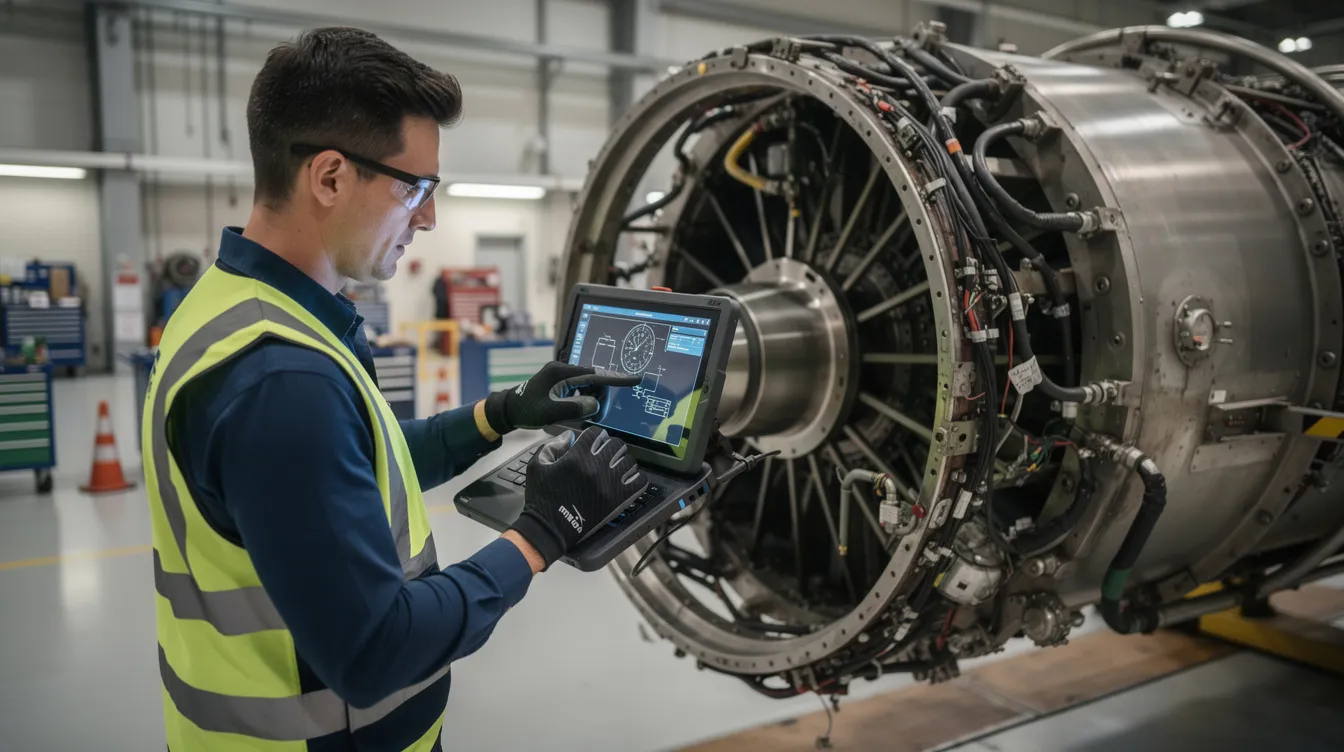
MRO closes the loop with disassembly findings, repair schemes, and life-limited part tracking over 20 to 30 year service lives. FAA continuing airworthiness mandates and component log cards demand back-to-birth traces. Connect981’s digital work instructions and shopfloor execution act as the on-the-floor segment of the thread, ensuring what actually happened matches design intent and regulatory requirements.
Digital Thread vs Traditional Aerospace Traceability Systems
Legacy systems in aerospace manufacturing rely on paper travelers, spreadsheets, siloed MES and QMS applications, and email-based supplier coordination. In multi-site, multi-supplier programs like the F-35 with over 1,500 suppliers, these approaches lead to estimated 20 to 30 percent data fidelity degradation per handoff and audit delays measured in months rather than days.
Point solutions fail to address end-to-end needs. Standalone PLM lacks shopfloor execution visibility. Standalone MES lacks supplier integration. Neither provides the cross-system relationships required for complete visibility across aerospace operations.
A modern digital thread architecture acts as a data fabric that normalizes identifiers and relationships across systems. This enables scenarios that would be impossible with legacy systems: identifying all aircraft and assemblies affected by a suspect titanium lot without halting the entire fleet, or tracing a misconfigured torque tool to every fastener it touched in the past 90 days.
Dimension
Legacy Approach
Digital Thread Approach
Speed
Weeks for audit response
Hours for complete trace
Data completeness
70-80% after handoffs
Full chain preserved
Audit readiness
Manual compilation
Automated evidence packages
Supplier visibility
Email and PDF exchange
Shared traceability portal
Recall containment
Fleet-wide action
Targeted serial/lot action
Connect981 acts as a unified operations layer bridging ERP systems like SAP, PLM platforms like Siemens and Dassault, existing MES, and QMS with real-time shopfloor and supplier execution data. This approach preserves existing system investments while eliminating data silos that break traceability.
Core Elements of an Aerospace Digital Thread Architecture
A functional digital thread architecture requires specific technical elements designed for the aerospace sector’s unique demands around regulatory compliance, long product lifecycles, and multi-organization data sharing.
Master Data Model
The foundation is an ontology-based data model that defines relationships between entities: parts, assemblies, operations, inspections, certifications, and configurations. This model must handle the complexity of aerospace bills of materials while supporting relationships across mechanical, electrical, software, and firmware domains.
Normalized Identifiers
Serial numbers, lot numbers, batch numbers, and work order numbers must be harmonized across systems. The data normalization supporting article covers this in detail. Without unified identifiers, cross-system queries return incomplete results or fail entirely.
Integration Interfaces
Secure APIs connect PLM, ERP, MES, QMS, and supplier portals. These interfaces must handle bidirectional data flow, pushing work orders downstream and pulling execution data upstream. Information silos form when systems cannot exchange data in real time.
Event Logs and Audit Trails
Time-stamped event histories capture who did what, when, using which revision of instructions and which certifications. This supports audit trail systems requirements and provides the evidence chain regulators expect.
- Multi-site deployments with consistent data models across locations
- ITAR-segregated data handling for defense programs
- Role-based access controlling visibility by program, site, or function
- Long-term archival supporting 20 or more year retention requirements
- Low-code workflow configuration for aerospace-specific compliance processes
Connect981 fits into this architecture through its zero and low-code workflow builder, integration endpoints, and data model explicitly designed for aerospace documentation and traceability. The platform enables rapid deployment without requiring custom development for standard aerospace traceability processes.
Digital Thread on the Shopfloor: From Work Instructions to Audit Trails
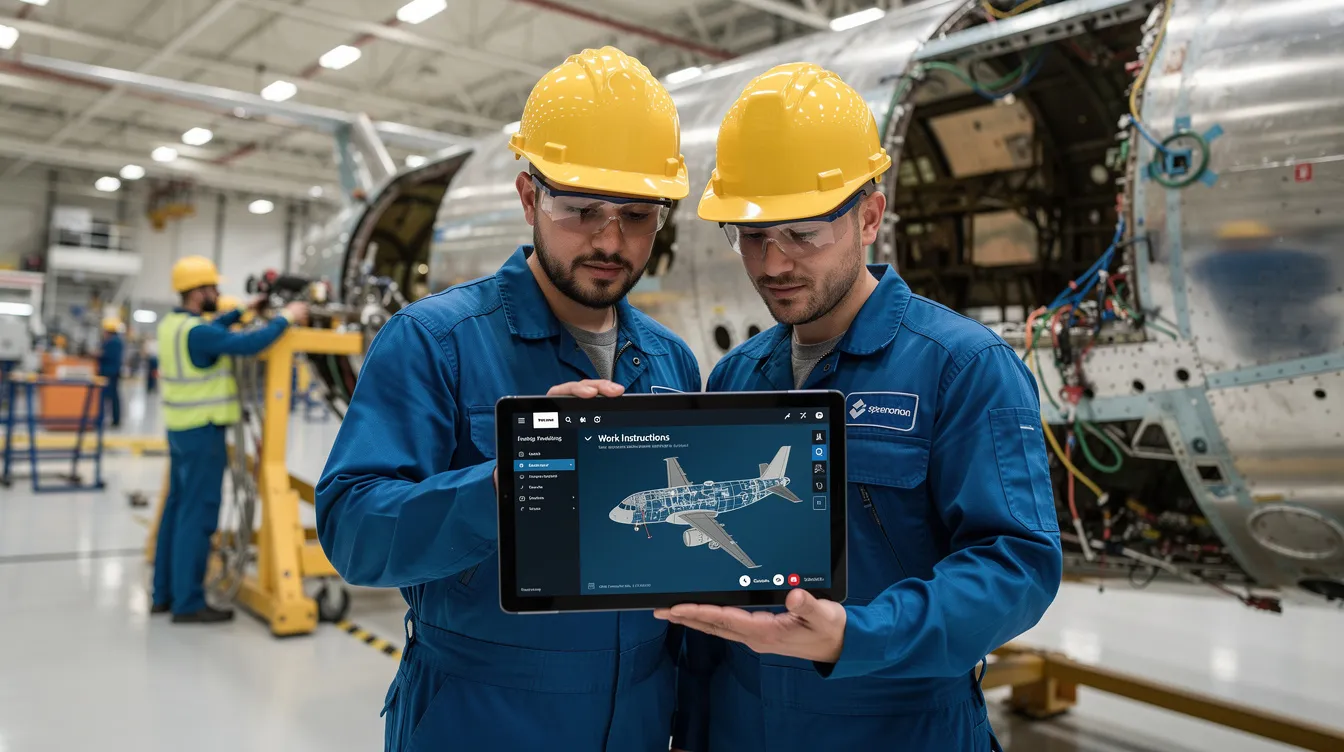
The digital thread is realized at the point of execution where operators, inspectors, and supervisors follow digital work instructions. This is where theoretical traceability becomes operational reality through data collection at the source.
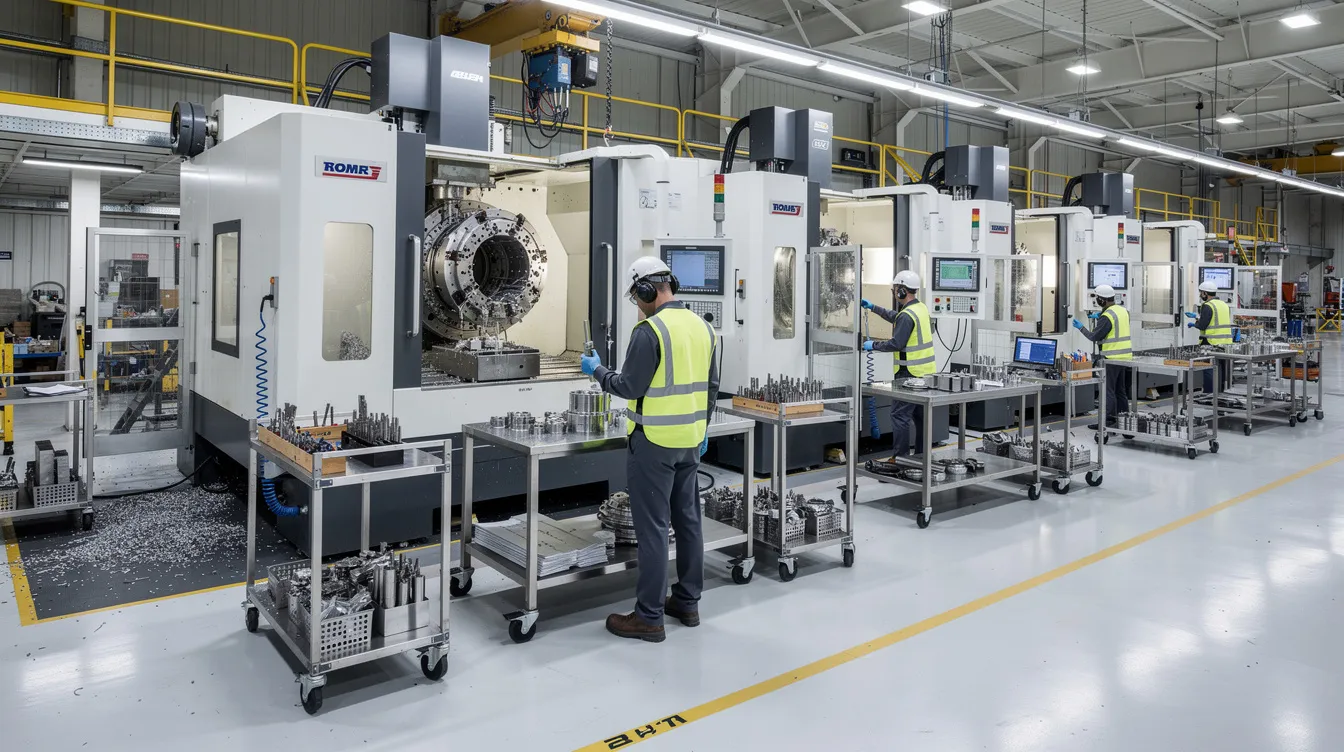
Shopfloor execution captures real-time data that becomes part of the permanent audit trail: machine settings, torque values, inspection results, nonconformances, rework paths, and sign-offs tied to individual serial numbers and lots. Every data point links backward to requirements and forward to fielded assets.
Digital work instructions in Connect981 maintain version control and ensure operators always see the correct revision for a given configuration and regulatory context. When a drawing revision changes, the platform ensures only current instructions are available for execution, reducing human error from outdated documentation.

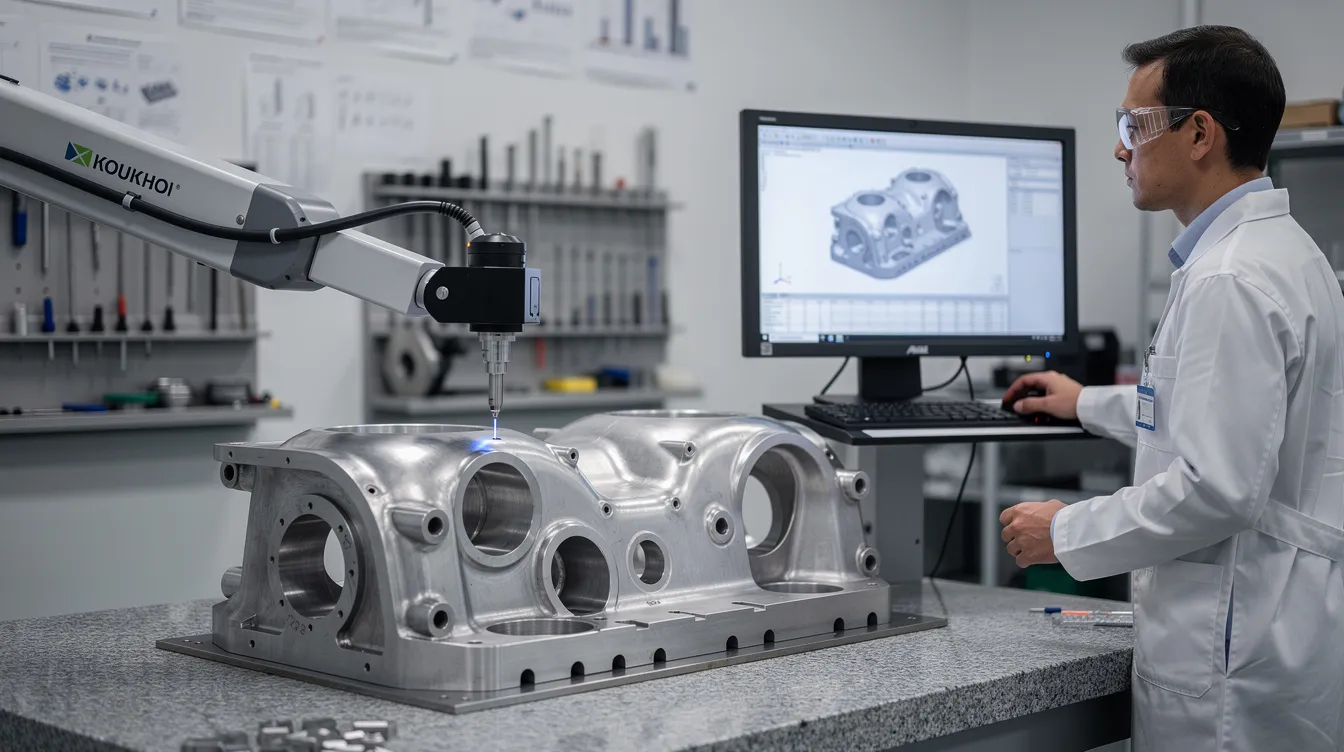
Consider an AS9102 FAI for a structural bracket on an Airbus A320neo or an F-35 subassembly. The digital thread captures:
- Ballooned dimensions linked to CAD source data
- Operator identification and timestamp for each measurement
- Calibrated inspection equipment serial numbers
- NDT results linked to heat lot certifications for raw materials
- Any deviations triggering MRB workflow with disposition records
- Final sign-offs creating the audit-ready FAI package
Every operator action, deviation, and quality decision becomes part of comprehensive records automatically linked across the product lifecycle. Quality control data flows into analytics systems for continuous improvement without manual data entry or transcription.
Extending the Digital Thread to Suppliers and Multi-Tier Networks
The aerospace digital thread must cross organizational boundaries spanning OEMs, Tier 1 through Tier 3 suppliers, special processors, and repair stations. Supply chain management in aerospace involves complex multi-tier networks where traceability cannot stop at the factory gate.
Typical issues in supplier traceability include mismatched part numbers, incomplete Certificates of Conformance, missing heat lot data, and unlogged process deviations at outside processors. These gaps create compliance risk and slow containment when quality issues emerge.
Shared portals or integrated workflows allow secure exchange of build records, certifications, First Article Inspection Reports, and deviation approvals. Connect981’s supplier workflow integration enables this data sharing while maintaining appropriate access controls and ITAR compliance where required.
Real-world scenarios illustrate the value:
- Validating a NADCAP special process at a coating supplier across multiple regions
- Responding to a material documentation inquiry affecting parts from a specific supplier lot
- Tracing all assemblies that incorporated raw materials from a flagged heat lot
- Coordinating deviation approvals across multiple sites and suppliers in real time
The supplier traceability supporting article covers these concepts in greater depth. The digital thread serves as the mechanism for end-to-end visibility across the supply chain, ensuring that OEM traceability extends through every tier that touches the product.
Digital Thread in MRO: Closing the Loop from Fleet to Factory
MRO operations at airlines, MRO shops, and defense depots generate critical data that should feed back into the digital thread for design and manufacturing teams. This closed loop system enables learning from operational experience.
Aircraft operate for 20 to 30 years, accumulating maintenance records, component replacements, and service history. Tracking serialized life-limited parts, repairs, and service bulletins over this timeframe requires a persistent digital thread that connects back to original production data. Regulatory requirements from FAA and EASA continuing airworthiness mandates demand back-to-birth traces for critical components.
Integrating MRO workflows into platforms like Connect981 supports full lifecycle traceability:
- Turnaround time optimization: Linking disassembly findings to prior production data accelerates diagnosis and reduces time to return aircraft to service
- AD and SB traceability: Tracking Airworthiness Directive and Service Bulletin compliance status across the fleet with complete evidence packages
- Repair approval chains: Maintaining full disposition records for non-standard repairs with links to engineering authority
- Component swaps: Recording serialized part removals and installations with complete audit trails
The benefits extend beyond compliance. Faster root cause analysis reduces downtime by 20 to 40 percent through predictive analytics. Data-driven design changes emerge from real-world failure modes captured in MRO operations. Manufacturing and engineering teams gain valuable insights into how their products perform over time, enabling continuous improvement in future designs.

Using Digital Thread Data for Quality, Analytics, and Continuous Improvement
A well-implemented digital thread produces high-quality, structured data suitable for advanced analytics and artificial intelligence insights. The connected data fabric enables analyses impossible with siloed systems.
Practical use cases include:
- Defect trend identification: Correlating defects across time, shift, station, and supplier to identify patterns before they become systemic
- Supplier quality correlation: Linking supplier lots to scrap rates and DPPM metrics to inform supplier performance management
- Early warning indicators: Detecting MRO findings that suggest emerging design or manufacturing issues
- Virtual testing validation: Comparing simulation predictions to actual in-service performance data
Connect981’s analytics capabilities include real-time dashboards, defect hotspot visualization, and AI-assisted root cause analysis leveraging tightly linked production and quality history. These traceability tools transform raw data into actionable intelligence.
Key performance indicators enabled by digital thread data:
Metric
Description
Target
DPPM
Defective parts per million by supplier, process, or station
<100 for critical processes
Rework rate
Percentage of units requiring rework before acceptance
<5%
On-time FAI
First Article Inspections completed within scheduled window
>95%
Audit response time
Hours to compile complete evidence package
<4 hours
Containment scope
Precision of affected unit identification
100% accuracy
This granular history enables targeted recalls and containment actions. When a quality issue emerges, the digital thread identifies exactly which serial numbers are affected, improving efficiency in response and minimizing disruption to unaffected production.
Implementing a Digital Thread in Existing Aerospace Operations
Most aerospace manufacturers operate in brownfield environments with existing ERP, PLM, some MES capabilities, and entrenched manual processes. Implementation must work within these constraints rather than requiring wholesale system replacement.
First 90 Days: Foundation
- Map current data sources across PLM, ERP, MES, QMS, and supplier systems
- Define unified identifier strategy: harmonized part numbers, revision schemes, serial number formats
- Identify critical programs or high-risk components for initial focus
- Establish data governance policies for ownership and maintenance
- Deploy initial Connect981 instance with core integrations
6 to 12 Months: Expansion
- Digitize work travelers for high-risk components like engine parts and structural assemblies
- Implement serial number traceability on a flagship program
- Automate FAI and AS9102 data capture with digital work instructions
- Integrate key Tier 1 suppliers into traceability portal
- Establish real time tracking for critical process parameters
Full Rollout: Maturity
- Extend site-by-site across manufacturing network
- Integrate MRO data feeds for operational feedback
- Deploy analytics dashboards for quality assurance and operational efficiency tracking
- Expand supplier integration to Tier 2 and special processors
- Implement predictive analytics for defect prevention
Quick wins build momentum. Organizations typically achieve 50 percent audit time reduction within the first six months. Digitizing travelers for high-risk components demonstrates value while building organizational capability for broader deployment.
Data normalization and governance remain critical throughout. Harmonized part numbers, revision schemes, and naming conventions across sites and suppliers prevent the fragmentation that undermines traceability. Change management addresses resistance by demonstrating how digital workflows reduce burden rather than adding complexity.
Connect981 serves as a low-code, fast-deployment layer that can roll out line-by-line or site-by-site without a multi-year MES replacement. The platform integrates with existing systems rather than replacing them, accelerating time to value.
How Connect981 Powers the Digital Thread for Aerospace and MRO
Connect981 creates a connected shopfloor and supplier network that plugs into existing ERP, PLM, and QMS systems to realize a true digital thread. The platform bridges gaps between enterprise systems and point-of-execution data.
Key capabilities in the context of digital thread:
- Digital work instructions: Version-controlled instructions ensuring operators execute the right revision for each configuration
- Work order execution: Real-time tracking of work order status and completion with automatic audit trail generation
- Serial and lot traceability: Full chain from raw materials through final assembly to fielded asset
- Supplier collaboration: Secure portals for CoC exchange, FAIR submission, and deviation coordination
- Quality logging: Defect capture, nonconformance tracking, and MRB disposition management
- Audit-ready histories: Complete evidence packages generated on demand for regulatory audits
Aerospace use-case vignettes:
A Tier 1 supplier used Connect981 to harmonize traceability across three plants producing assemblies for a major OEM program. Within 60 days, the organization eliminated discrepancies in serial number formats and established consistent build traveler data across all sites. Audit preparation time dropped from two weeks to two days.
An MRO operation deployed Connect981 to link disassembly findings to prior production data. Technicians access component production history directly from digital work instructions, reducing diagnostic time and improving first-time fix rates. Turnaround time improved by 30 percent on heavy maintenance visits.
Connect981 differentiates from generic MES and PLM through aerospace-specific data models designed for AS9100, ITAR, and FAA/EASA compliance. Rapid deployment in weeks rather than years enables organizations to close traceability gaps before the next audit or the next quality incident.
Request a Demo to see how your existing systems can be connected into a working digital thread.
Conclusion: Making Digital Thread the Backbone of Aerospace Traceability
The digital thread is no longer optional. Recent safety incidents, supply chain scrutiny, and tightening aerospace regulations have made connected traceability an operational necessity. Organizations that cannot demonstrate complete evidence chains from requirements through production to maintenance face growing regulatory and customer expectations.
A robust digital thread connects part traceability, lot tracking, supplier traceability, audit trails, and serial number traceability into one coherent system. This integration transforms data from a compliance burden into a strategic asset that enhances collaboration across engineering teams, production, quality assurance, suppliers, and MRO operations.
Evaluate where your current traceability breaks. Paper travelers that lose information between stations. Missing supplier documentation that delays audits. Slow evidence compilation that extends audit response from hours to weeks. Each gap represents risk that a connected digital thread can eliminate.
Supporting articles dive deeper into specific topics: part-level traceability, lot tracking, supplier traceability, audit trail systems, data normalization, and serial number traceability. Together, they provide a comprehensive view of modern aerospace traceability systems.
- Assess current state: Map where traceability breaks across your production and supplier network
- Prioritize high-risk gaps: Focus first on components and processes where regulatory exposure is highest
- Connect existing systems: Deploy a unified operations layer like Connect981 that preserves existing investments
- Request a Demo: See how your organization can move from fragmented data to a resilient, audit-ready digital thread within weeks