Designing an AS9102 Workflow: Best Practices from Planning to Submission
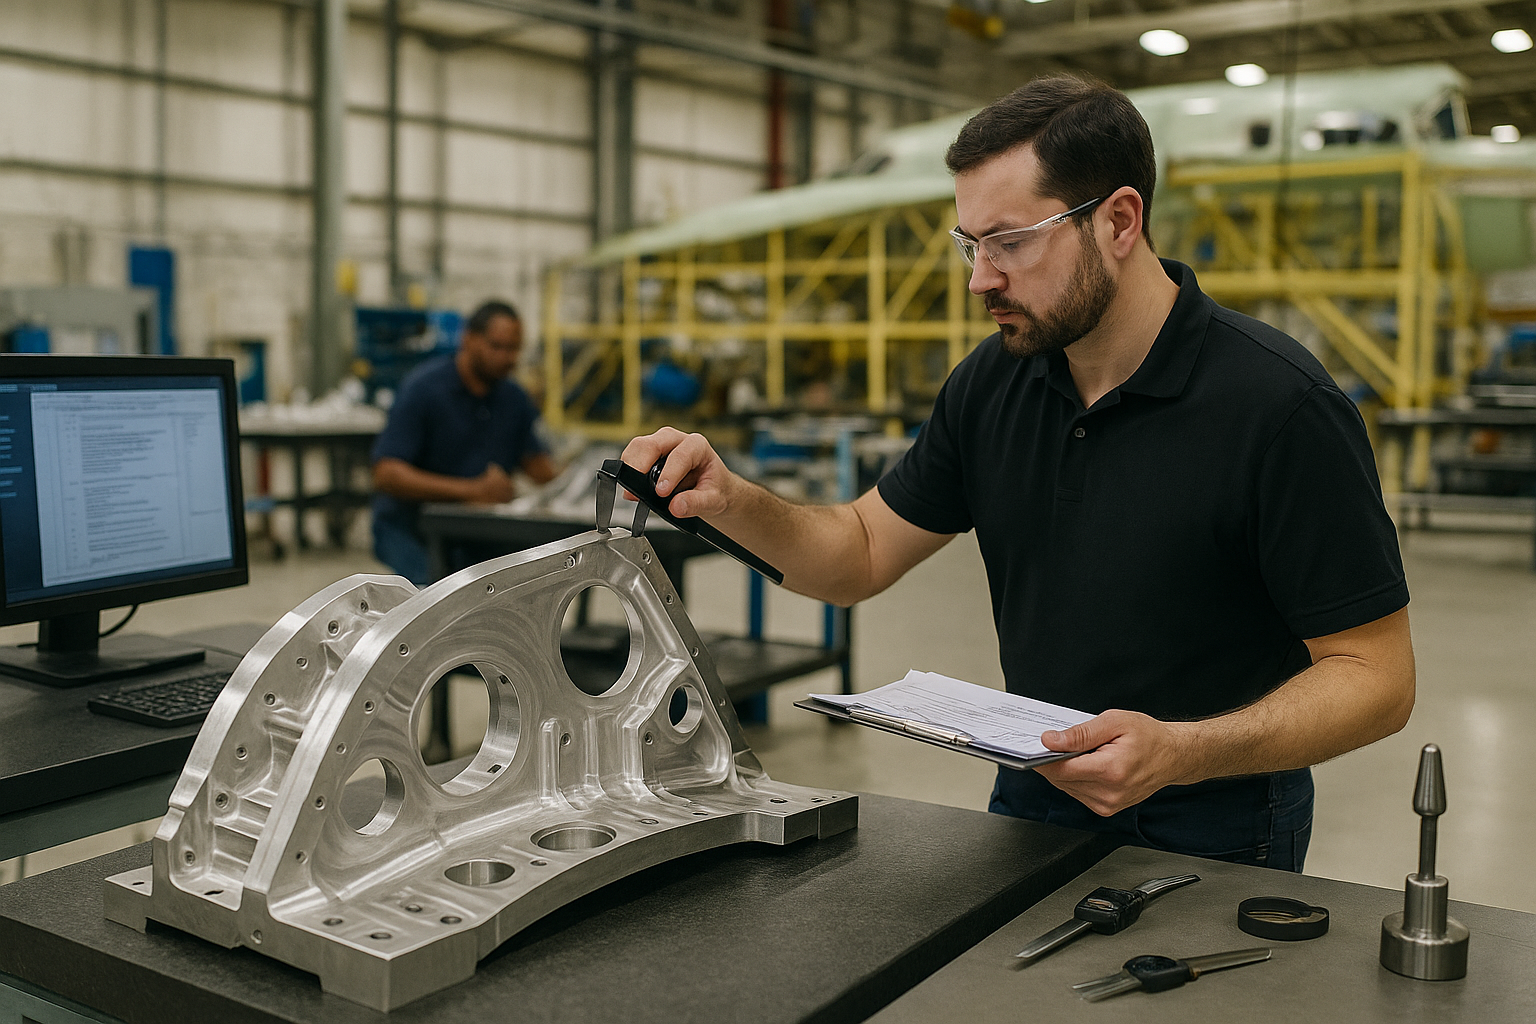
Aerospace manufacturers, defense programs, and space hardware suppliers all depend on reliable first article inspection (FAI) to prove that new or changed production processes can consistently deliver conforming hardware. AS9102 defines the minimum requirements, but it does not tell your organization how to design the day-to-day workflow across engineering, quality, operations, and suppliers. That design choice determines whether FAIs move smoothly or become a recurring bottleneck.
This article describes a practical end-to-end AS9102 workflow from planning through execution, review, and submission, and then shows how to standardize it across plants and suppliers using digital tools. It complements the broader perspective on digital article inspection in AS9102 software for digital first article inspection, focusing specifically on workflow design, roles, and governance.
For teams putting this topic into daily operation, digital AS9102 FAI help connect the concept to traceability, work-order reality, and audit-ready evidence.
For teams putting this topic into daily operation, digital AS9102 FAI, a connected execution platform, Connect 981’s aerospace execution solutions help connect the concept to traceability, work-order reality, and audit-ready evidence.
The same operating model also depends on real aerospace execution examples, Connect 981’s aerospace operations guidance, practical aerospace operations FAQs, especially when decisions have to move across quality, production, suppliers, and program leadership without losing context.
Planning the AS9102 FAI
A robust AS9102 workflow starts before any balloons are placed on a drawing. Planning clarifies when FAI is required, what will be inspected, and how responsibilities are divided across teams and organizations.
Determining when FAI is required
AS9102 specifies common triggers for FAI, but each aerospace organization must translate these into clear rules embedded in its quality management system (QMS) and production planning processes. Typical triggers include:
- New part introduction to production or to a particular site or supplier.
- Engineering changes that affect form, fit, or function.
- Process changes such as new equipment, tooling, or manufacturing location.
- Changes in material, source, or software that affect product characteristics.
- Production lapses exceeding the time limit defined in your QMS or customer requirements.
In a mature workflow, FAI triggers are not left to memory or tribal knowledge. Instead, they are encoded in planning rules inside ERP, MES, or an integrated quality platform so that a work order or configuration automatically indicates whether a full, partial, or delta FAI is required. That automation avoids missed FAIs and late discovery of requirements at shipment.
Defining scope and classification of characteristics
For each FAI event, the planning step must define the technical scope. This includes identifying the applicable configuration and deciding how to classify characteristics, such as:
- Standard characteristics inspected according to drawing tolerances.
- Key characteristics (KCs) that significantly affect performance, reliability, or manufacturability.
- Critical characteristics (CCs) that relate directly to safety of flight or regulatory requirements.
Classification drives the depth of evidence expected on Form 3, sampling plans, and the level of process capability analysis that may accompany the FAIR. In a digital workflow, these classifications should be stored as structured data, not handwritten notes, so that downstream inspection plans and dashboards can easily distinguish KCs and CCs across part families and programs.
Coordinating with customers on expectations and formats
Many primes and Tier 1 customers add program-specific requirements on top of AS9102, such as unique FAIR templates, additional traceability fields, or naming conventions. Effective FAI planning therefore includes explicit customer coordination:
- Confirm whether the customer requires its own template or will accept your standard AS9102-compliant format.
- Check if any additional evidence—such as capability studies, special process logs, or test data—must be bundled with the FAIR.
- Align on submission method (portal upload, EDI, email) and review timelines.
Digital systems can codify these expectations into customer-specific profiles so that each FAIR inherits the correct template and export format based on customer, part family, or contract.
Preparing Drawings, Data, and Inputs
Once an FAI is triggered and scoped, the next step is to ensure all technical inputs, documents, and digital structures are in place. Preparation quality strongly influences the cycle time and accuracy of the final FAIR.
Ensuring correct drawing revision and configuration
Configuration management is a critical risk area in aerospace production. Before ballooning or inspection planning begins, the team must verify that:
- The drawing or model being used matches the configuration defined on the contract and work order.
- All associated specifications and notes are at the correct revision level.
- Digital systems consistently reference the same revision across PLM, ERP, MES, and FAI tools.
In connected factories, this is handled by linking FAIRs directly to controlled configuration objects (e.g., engineering change orders or released models). The FAI workflow should prevent creation of a FAIR against an obsolete revision and should preserve traceability when a delta FAI is required after a design change.
Gathering material, process, and certification requirements
Beyond the drawing, AS9102 requires evidence that materials and special processes comply with design requirements. During preparation, the responsible engineer or planner should:
- Identify all material specifications and associated certificates that must be captured on Form 2.
- List all special processes (e.g., heat treatment, surface treatment, welding, NDT) and correlate them with internal or supplier process approvals.
- Clarify which process outcomes (hardness, coating thickness, conductivity, etc.) must be recorded as results versus simply documented through certificates.
Digital FAI tools can help by enforcing required attachments, linking process records and material lots to the FAIR, and flagging missing certifications before approval.
Setting up digital templates and checklists
Standardization begins at the template level. Rather than letting each engineer build FAIRs from blank forms or ad hoc spreadsheets, leading aerospace organizations maintain controlled digital templates and checklists that define:
- Fields and structure of Forms 1, 2, and 3 in alignment with AS9102 Rev C.
- Additional internal fields required by the QMS (e.g., internal routing numbers, process owner codes).
- Checklist items for planning, including trigger confirmation, rev checks, and customer-specific expectations.
Workflow-oriented platforms can automatically instantiate these templates based on part type, risk category, or customer. This reduces variability and accelerates training for new engineers or supplier quality teams.
Executing the FAI
Execution is where most effort and error risk concentrates: ballooning the drawing or model, capturing actual results, and managing issues discovered during inspection. A disciplined, digital-first workflow minimizes manual transcription and enforces characteristic accountability.
Ballooning drawings and extracting characteristics
The first visible step in execution is creating the ballooned drawing or model view. In a modern workflow, this should be done using software rather than manual markup.
- Drawings (or 3D models with PMI) are imported into FAI software that identifies dimensions, GD&T, notes, and other inspection-relevant requirements.
- Each requirement receives a unique balloon number, which becomes a persistent identifier for that characteristic.
- Engineers review and validate detected characteristics, adding any overlooked notes or process-related requirements.
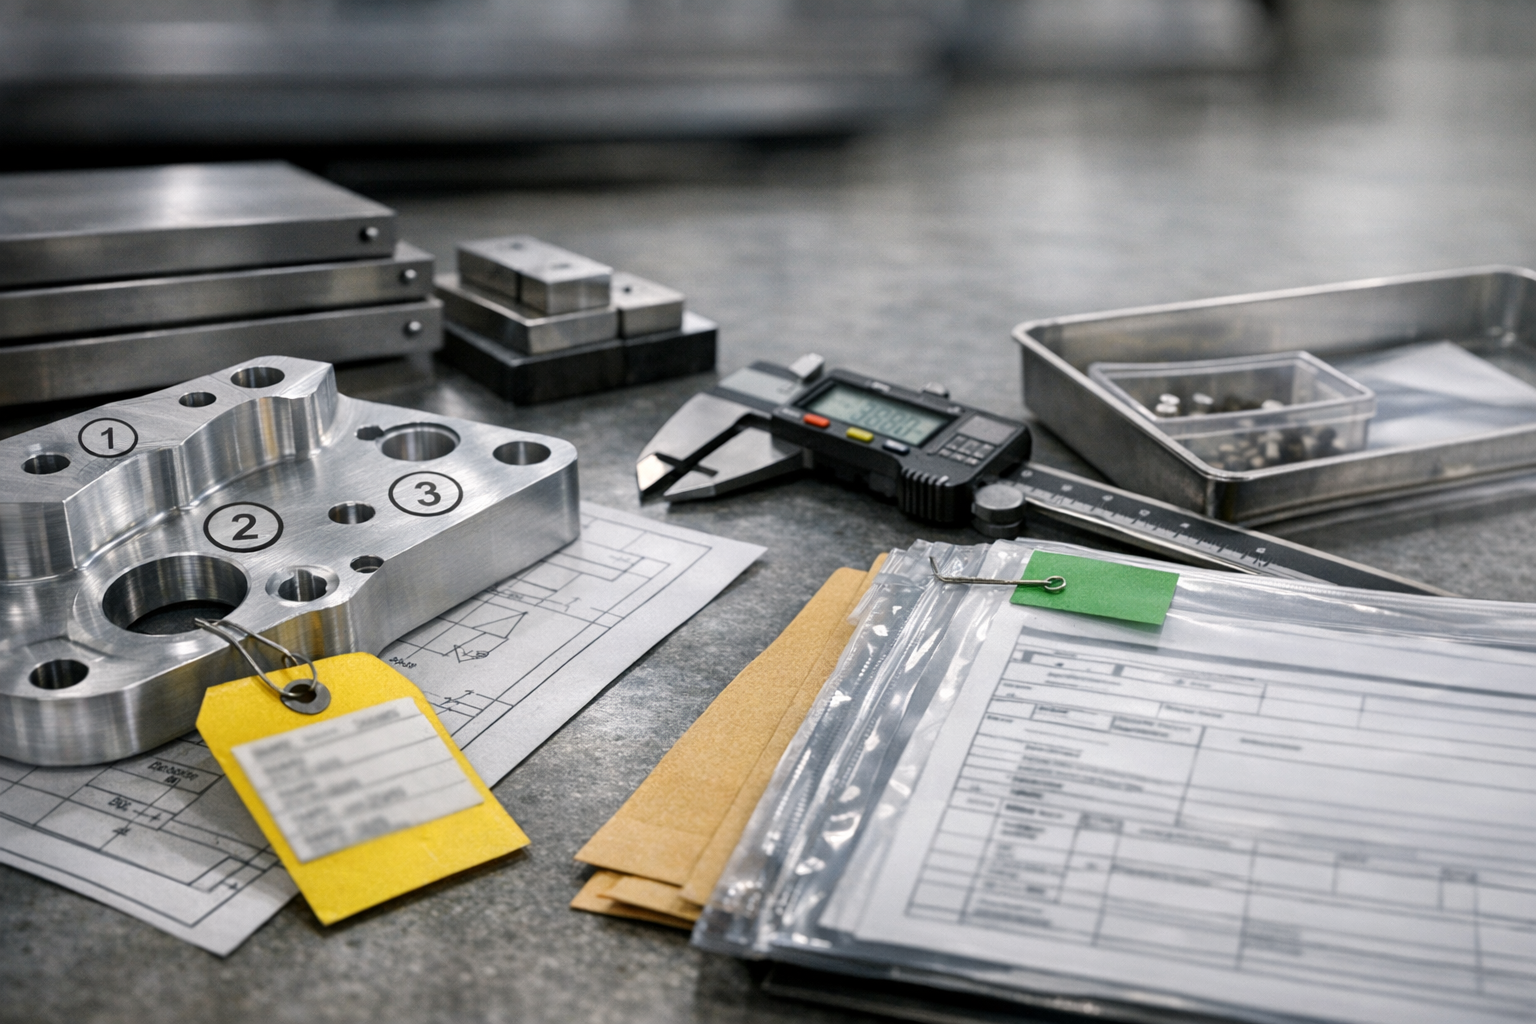
The crucial principle is one characteristic, one balloon, one Form 3 line. This mapping is the backbone of traceability. Once balloons are confirmed, the system should auto-generate the Form 3 characteristic list and maintain a reliable link back to the visual representation.
Collecting measurement and test data
Next, inspection and test results are gathered for each characteristic. In an optimized AS9102 workflow, manual entry into spreadsheets is avoided wherever possible. Instead, organizations integrate multiple data sources:
- CMM programs and other metrology systems that push results directly into the characteristic fields on Form 3.
- Digital checklists or MES terminals used by operators to record in-process inspection measurements.
- Laboratory test results (e.g., hardness, conductivity, tensile) imported as structured data and linked to the relevant balloons.
Validation rules in the digital FAIR form help catch issues such as missing units, out-of-range values, or inconsistent decimal precision. When nonconformances are found, they should trigger formal nonconformance records, not just notes in the FAIR.
Managing rework and nonconformances during FAI
Inevitably, some FAIs uncover discrepancies. The workflow must define how to respond without losing traceability or compromising compliance.
- Nonconformances are logged in the QMS with a clear link back to the specific characteristic and FAIR.
- Rework is planned and executed through controlled work instructions, with repeat measurements recorded against the same balloon numbers.
- If disposition decisions (e.g., use-as-is, repair, deviation) are required, these are documented in the QMS, while the FAIR records the final accepted result.
The FAIR itself should not become a substitute for nonconformance or deviation processes. Instead, it acts as a structured summary of final, accepted results, with references to the supporting quality records.
Review, Approval, and Submission
Even well-executed inspections can fail if review and approval are inconsistent or poorly documented. AS9102 workflows should make these steps explicit, role-based, and digitally controlled.
Internal review and quality signoff
Before any FAIR is sent to a customer, an internal review ensures completeness and accuracy. Typical checks include:
- Verification that all applicable characteristics are accounted for and correctly mapped.
- Confirmation that Forms 1, 2, and 3 are coherent (e.g., part numbers, revisions, and serials match across forms).
- Checks that required supporting documents—material certs, process logs, test reports—are attached and legible.
Digital workflows can formalize these reviews using checklists, role-based tasks, and dashboards that highlight missing or inconsistent data. This reduces reliance on individual reviewer experience and improves consistency across sites.
Electronic signatures and controlled approvals
Many aerospace organizations operate in environments that require secure, auditable electronic signatures. A best-practice FAI workflow therefore includes:
- Role-based approval routing (e.g., manufacturing engineering, quality engineering, quality manager).
- Electronic signatures that are tied to individual user identities and time-stamped, with clear indication of which form or revision was approved.
- Immutable audit logs that show who changed what and when between draft and approved FAIRs.
This approach supports both AS9100 expectations and regulatory requirements, and it makes responding to customer or registrar questions significantly easier during audits.
Submitting FAIRs and responding to customer feedback
Submission is more than just sending a PDF. The workflow should clarify:
- Submission channels (customer portal, secure file transfer, or integrated interfaces).
- Required file formats (native digital format, PDF, data exchange formats) per customer or program.
- Responsibilities for tracking status, recording customer approvals, and managing rejections or clarification requests.
Digital platforms can track FAIR status across the supply chain—draft, submitted, under review, accepted, or rejected—giving program and quality leaders visibility into where FAI-related delays might affect deliveries.
Standardizing Workflows Across Sites and Suppliers
Designing a single robust AS9102 workflow is only the first step. The real challenge for aerospace companies is ensuring that the same principles are applied consistently across internal plants and external suppliers, without ignoring local constraints or customer-specific clauses.
Common templates and process maps
Standardization starts with a documented reference workflow and shared templates. Organizations often define:
- A core process map that outlines planning, preparation, execution, review, and submission steps.
- Standard digital templates for Forms 1–3 and for supporting checklists.
- Risk-based variants of the workflow (e.g., enhanced review for critical parts or programs).
These artifacts should be centrally controlled but configurable so that sites and suppliers can tailor fields or steps to satisfy local regulatory requirements or customer demands while still staying aligned with the corporate standard.
Training and competency development
Even the best-designed AS9102 workflow fails if engineers and inspectors do not fully understand the intent behind each step. Organizations should treat FAI as a core competency, not an occasional paperwork task, by:
- Providing structured onboarding for new engineers and supplier quality staff on AS9102 concepts and internal workflow expectations.
- Using real FAIR examples—including both strong and weak submissions—to illustrate acceptable practice.
- Leveraging digital tools to embed guidance into forms themselves (tooltips, in-form examples, links to procedures).
Competency assessment can be supported with periodic FAIR reviews, peer audits, or spot checks that focus on systemic understanding, not just form completion.
Governance for changes to FAI procedures
As AS9102 evolves and customers update their requirements, FAI workflows must adapt while preserving traceability. Governance mechanisms should include:
- Formal change control for FAI procedures, templates, and digital workflows.
- Impact assessment to determine which programs, sites, or suppliers are affected by a change.
- Versioning of FAIR templates and associated instructions so that past FAIRs remain linked to the procedures in effect at the time.
Digital workflow engines make it easier to implement these changes consistently and to document which FAIRs were built under each procedural version—critical evidence during audits or investigations.
Embedding Continuous Improvement into the AS9102 Workflow
FAI is often viewed as a compliance burden, but it also produces rich data about product design, process capability, and supplier performance. Organizations that treat FAI data as an improvement asset can reduce future defects and streamline new product introduction.
Capturing lessons learned from each FAIR
Each completed FAIR should feed a structured lessons-learned process. Typical topics include:
- Characteristics that were consistently close to tolerance limits, indicating potential process capability concerns.
- Design features that were difficult to inspect or that required complex setups.
- Recurring issues with particular suppliers, processes, or materials.
Digital platforms can capture these insights in a standardized way—through tags, structured comments, or dedicated review steps—and make them discoverable for future programs and engineering change assessments.
Using metrics to refine workflows and training
To understand the effectiveness of the AS9102 workflow, aerospace leaders should track quantitative metrics, such as:
- Average cycle time from FAI trigger to customer-accepted FAIR.
- Percentage of FAIRs rejected due to documentation or traceability issues.
- Number of late deliveries where FAI delays were a contributing factor.
- Frequency and impact of FAI-related audit findings.
By analyzing these metrics across programs, sites, and suppliers, organizations can identify where training, template refinement, or additional automation will produce the highest return.
Integrating FAI feedback with design and process engineering
Finally, the AS9102 workflow should connect back into the broader digital thread of aerospace product development and manufacturing. Examples include:
- Using FAI measurement data to inform design-for-manufacturability reviews and tolerance optimization.
- Feeding recurring FAI issues into formal corrective action and process improvement projects.
- Linking FAIRs to configuration-managed design and planning objects so engineering can see exactly how changes affected process capability.
Platforms like Connect 981 position FAI as one node in a connected aerospace operations environment, rather than an isolated document. This perspective enables better decisions across engineering, production, and supplier management, while still respecting that each organization must tailor workflows to its own QMS and customer expectations.
When designing or refining your AS9102 workflow, treat this reference model as a guide, not a rigid prescription. Align each step with your existing QMS, regulatory context, and contractual requirements, and use digital tools to enforce consistency, improve visibility, and capture the data needed for continuous improvement across your aerospace manufacturing network.