Blog

  • Aerospace NCR Process: From Non Conformance Detection to Verified Closure

    Aerospace NCR Process: From Non Conformance Detection to Verified Closure

    Aerospace teams do not raise an NCR because paperwork is convenient. They raise it because a deviation has appeared in a system where product quality, airworthiness, schedule, and regulatory compliance are tied together. A non conformance report ncr is the controlled mechanism for making that deviation visible, contained, investigated, and effectively resolved.

    This guide explains the aerospace ncr process from detection through containment, MRB, CAPA handoff, root cause analysis, and verified closure. It is written from Connect981’s perspective as an aerospace operations platform that digitizes NCR workflows across factories, MRO lines, and suppliers.

    Overview of the Aerospace NCR Process Workflow

    A Nonconformance Report (NCR) is a controlled quality record used to formally document, investigate, and resolve nonconformities identified during any phase of the product or service lifecycle. In aerospace manufacturing and MRO, the non conformance report is part of the quality management system and is central to meeting AS9100, FAA, EASA, OEM, and customer requirements. The aerospace industry requires strict adherence to quality standards to ensure regulatory compliance and airworthiness certifications.

    The lifecycle of an aerospace NCR includes identification, segregation, documentation, evaluation, and disposition of non-conforming parts. The typical nonconformance report process follows a structured workflow that begins with detection and initiation by QA, production, or inspection teams, followed by documentation, containment measures, assessment, investigation, and closure. Quality standards, such as AS9100 for aerospace, require organizations to manage nonconformities and take corrective actions to ensure compliance and continuous improvement.

    At a practical level, what happens after an NCR is raised is straightforward: the item is controlled, the risk is classified, relevant stakeholders are notified, MRB is involved when required, corrective and preventive actions are assigned, objective evidence is verified, and the audit trail is closed. Immediate containment means physical and digital action on the shopfloor to stop non conforming products from moving forward. MRB gets involved for major non conformance, design deviation, certified configuration, or flight safety concerns. CAPA should start when the issue is major, recurring, customer-facing, or systemic. Closure timing should be governed by severity, due dates, aging reports, and quality manager escalation.

    An aerospace technician is meticulously inspecting a machined aircraft component on a clean shop floor, ensuring it meets established quality standards and regulatory compliance. This inspection is a crucial part of the quality management system, aimed at identifying any non conformances and implementing corrective and preventive actions to maintain high product quality.

    What Is a Non Conformance in Aerospace Operations?

    Aerospace non conformance is any deviation from design data, process specification, regulatory requirement, or customer contract. It can be an Airbus A350 frame misdrill, a missed torque spec on a CFM56 fastener, incomplete maintenance sign-off on a 737 landing gear overhaul, or any condition where the work does not meet specified requirements. NCRs are essential for documenting deviations from approved specifications, procedures, or regulatory requirements, which is critical for maintaining quality standards in aerospace manufacturing.

    Non conformance usually falls into three categories:

    • Product non conformance: dimensional failures, wrong material, incorrect configuration, damaged parts, or nonconforming heat treatment.
    • Process non conformance: unapproved sequence, skipped inspection, expired calibration, missed cure parameter, or unauthorized repair method.
    • Documentation non conformance: missing EASA Form 1, incomplete FAA Form 8130-3, outdated work instruction revision, weak document control, or missing sign-off.

    Organizations should categorize non-conformances as minor or major to prioritize corrective actions effectively, ensuring that minor issues are addressed promptly to prevent them from escalating into major problems.

    • Minor non conformance: paint blemish not affecting corrosion protection, reworkable edge break, label misalignment, or documentation typo with no airworthiness impact.
    • Major non conformance: primary structure out of tolerance, missing required inspection, wrong alloy or heat treat on load-bearing parts, or work performed to the wrong drawing revision.
    • Safety-critical non conformance: crack in flight-critical hardware, unapproved repair on certified structure, or any issue that may compromise quality and safety standards.

    A documented process for identifying non conformance is required under AS9100 expectations. In the aerospace sector, compliance with AS9100 requires organizations to implement non-conformance reporting procedures to address any deviations from established quality standards and regulatory requirements. Regulatory requirements for non-conformance reporting are defined in international standards such as ISO 9001, AS9100 for aerospace, IATF 16949 for automotive, and FDA regulations for healthcare and medical devices. Non-conformance reporting procedures are mandated by various regulations to ensure that organizations consistently identify, document, and resolve deviations from quality standards, thereby maintaining compliance and product safety. In other sectors, including construction projects, NCR terminology is also used, but aerospace risk, traceability, and airworthiness requirements are materially higher.

    Step 1 – Detect and Record the Non Conformance

    The ncr process begins the moment anyone identifies a deviation. That may happen during first article inspection, in-process inspection, supplier receiving, line maintenance, heavy check, customer complaints about delivered hardware, internal audits, or regulator findings from FAA and EASA oversight. Quality assurance and quality control teams need a clear route to document non conformities without waiting for informal approval.

    Typical detection sources include CMM inspection failures, NDT rejects on structural components, torque audits, shopfloor operator observations, reliability program field events, and inspection data from MRO teardown. An effective non conformance report should capture the key elements at creation: date and time, facility, work center, work order or tail number, part number, serial number, batch, drawing or specification reference, detailed description, severity estimate, immediate status, applicable requirements, and an impact assessment to identify all potentially affected items. Effective non-conformance reporting requires clear documentation of the non-conformance, including a description of the issue, the applicable requirements, and the impact assessment to evaluate potentially affected items.

    Operators and inspectors must identify non conformance and open the NCR immediately. Quality engineers validate the finding, confirm proper documentation, and ensure the record enters a controlled NCR log. With Connect981, the NCR can be raised directly from a work order or inspection step using tablets or terminals. The platform pulls live part numbers, revision-controlled instructions, process records, and quality data so teams avoid rekeying errors and maintain instant traceability.

    Step 2 – Immediate Containment and Segregation

    Immediate containment is the set of actions taken within hours of detection to prevent further use of nonconforming parts, processes, or documents while the investigation proceeds. The NCR process is critical to maintaining flight safety and regulatory compliance in the aerospace sector because it ensures defective components never make it onto an aircraft, thereby preventing catastrophic failures.

    Containment includes tagging suspect parts, moving them to a quarantined MRB area, applying electronic holds in MES or ERP, freezing affected serial numbers and lots, and stopping use of an out-of-tolerance fixture or expired adhesive batch. Physical segregation of non-conforming parts prevents contamination of the aircraft assembly line and protects the production process from silent propagation of defects.

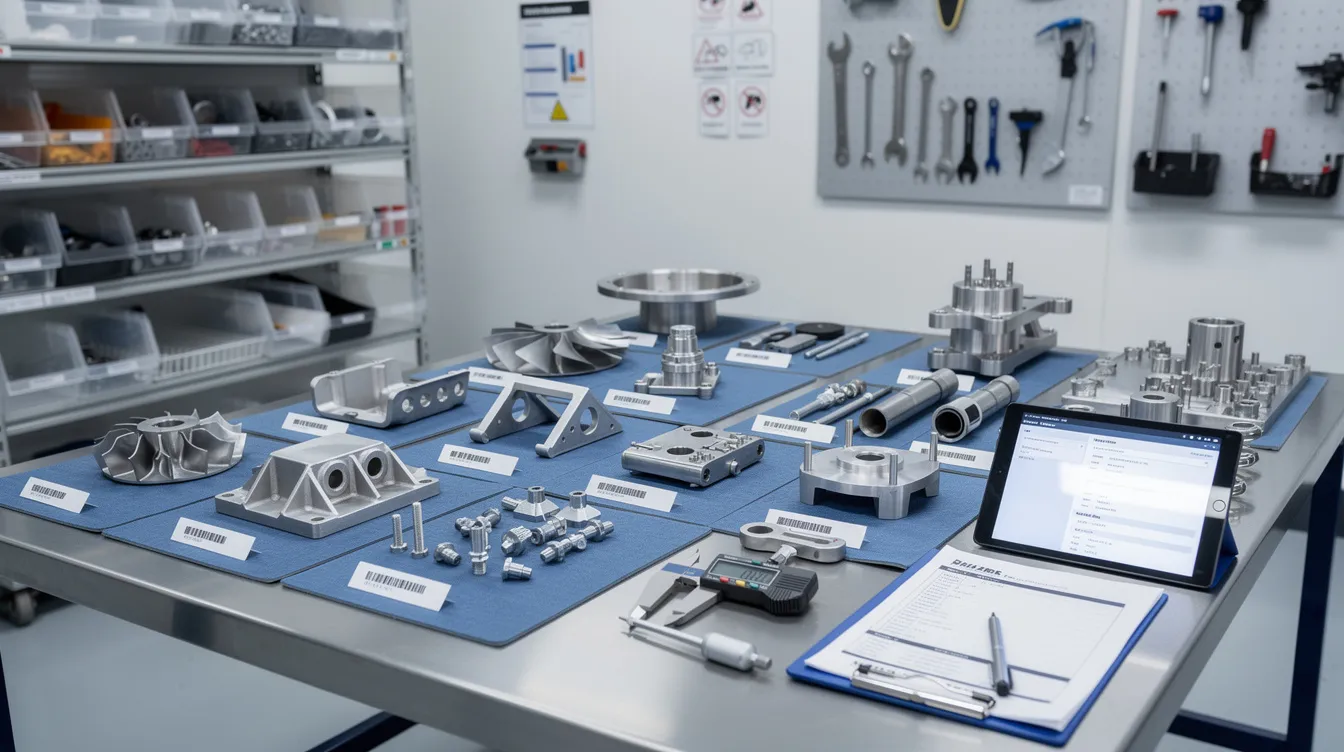
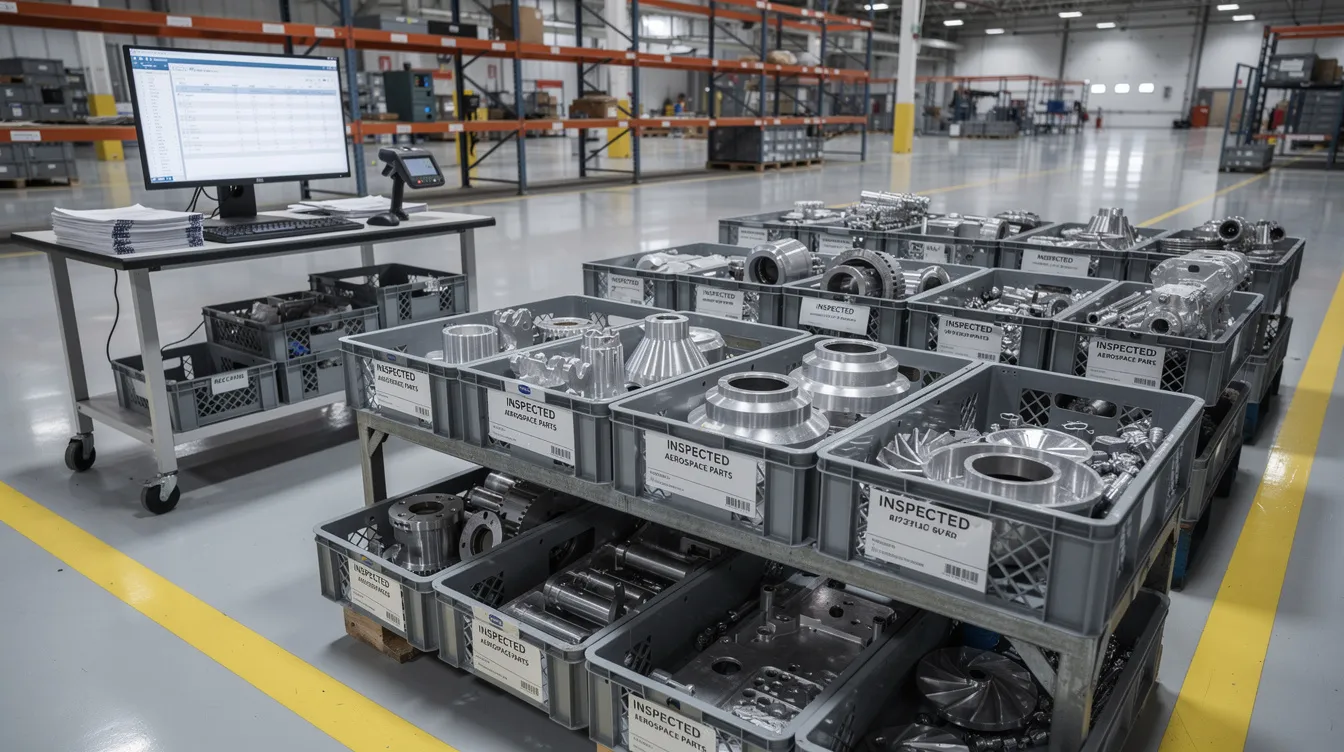
    The image shows aerospace parts arranged on a segregated inspection bench, with technicians actively engaged nearby, ensuring compliance with established quality standards and conducting thorough inspections as part of the quality management system. This setting emphasizes the importance of quality assurance and the non conformance reporting process in maintaining high safety and quality standards in aerospace manufacturing.

    Good containment also brackets the impact. Teams check previous and subsequent serial numbers, adjacent lots, recent jobs on the same tooling, and maintenance tasks on the same aircraft system. Production supervisors authorize stop-work, quality ensures physical and digital segregation, planning adjusts routing or schedules, and supply chain is notified if supplier material is involved. Connect981 supports this with real-time status flags, automated alerts to MRB and planners, and an audit trail showing who applied each hold and when.

    Step 3 – Evaluate, Classify, and Decide on MRB Involvement

    Once contained, the non conformance is evaluated for risk, scope, regulatory impact, and customer exposure. This classification drives risk management, resource allocation, and the path to disposition.

    Minor non conformance may include cosmetic paint defects not affecting corrosion protection, reworkable edge breaks, or documentation errors with no airworthiness impact. Major non conformance includes primary structure out of tolerance, missing required inspection, incorrect material, or wrong heat treatment. The phrase major non matters operationally because it usually changes approval authority and timing expectations.

    MRB should get involved when there is any major non conformance, design deviation request, repeated minor issue indicating systemic failure, certified configuration impact, airworthiness exposure, or contract flight safety clause. A Material Review Board (MRB) analyzes issues related to non-conforming parts and decides their fate based on defined paths: scrap, rework, repair, or use as-is. MRB membership typically includes the quality manager, design engineering, stress or structures engineering, manufacturing engineering, operations, and sometimes customer or regulatory representatives.

    A practical example is an A320 wing panel with undersized fastener holes. MRB may decide to scrap the panel, rework with oversized fasteners, repair under an approved engineering scheme, or use as-is with a design authority concession. Connect981 can route NCRs automatically to the correct MRB group by part family, program, supplier, or customer, then enforce electronic signatures for AS9100, FAA, and OEM audit readiness. AS9100D requirements for control of nonconforming outputs are commonly tied to clause 8.7 and corrective action expectations under clause 10.2, as summarized by AS9100 implementation guidance.

    Step 4 – Define Disposition and Handoff to CAPA

    MRB or quality leadership must formally decide disposition. Standard aerospace dispositions are:

    • Scrap: remove the item from usable inventory, update serial trace, and prevent accidental reinstatement.
    • Rework to print: return the part to specified requirements using approved instructions, followed by re-inspection.
    • Repair: apply an engineering-approved repair scheme with stress, design, or airworthiness sign-off where required.
    • Use-as-is: accept the condition with risk justification, concession, and customer approval where required.

    CAPA should start when the issue is a major non conformance, repeated minor non conformance above threshold, tied to customer complaints, linked to field reliability, found by regulator audit, or requiring design concession or notification. The NCR owner, often a quality engineer, retains ownership of the non conformance record. The CAPA owner, often manufacturing engineering, supplier quality, or maintenance engineering, owns systemic corrective and preventive measures.

    The handoff must preserve traceability between the NCR, corrective action, corrective and preventive actions, corrective and preventative actions, and preventive actions. Connect981 links NCR and CAPA workflows through the same data model, shared part and serial identifiers, aircraft identifiers, and dashboards showing which NCRs have open CAPA actions versus those cleared for closure. This prevents premature closure and supports complaint handling when customer-facing issues are involved.

    Step 5 – Root Cause Investigation and Corrective Actions

    For major non conformance and recurring issues, investigation must go beyond “operator error.” Root cause analysis is a structured investigation phase used to determine the underlying cause or combination of causes that led to a nonconformance, ensuring that corrective actions address the root cause to prevent recurrence. RCA may involve cross-functional input from QA, engineering, production, and supply chain, and is performed using validated methodologies like the 5 Whys technique or Ishikawa fishbone diagram.

    Typical aerospace RCA examples include 5 Whys on a mis-routed hose installation, fishbone analysis of repeated NDT failures on titanium forgings, fault tree analysis for a flight control component defect, and review of PFMEA and process control plans. The investigation should collect machine programs, revision history, calibration records, batch and heat numbers, technician training and certification records, environmental conditions, cure oven profiles, humidity data for bonding, and change history for drawings and work instructions.

    Effective corrective actions may include updating work instructions, adding visual aids, tightening inspection at critical control points, revising torque or cure parameters, retraining and requalifying technicians, updating supplier control plans, or modifying fixtures. The objective of root cause analysis is not only to identify the immediate cause of a nonconformance but also to uncover additional preventive actions for similar processes or areas to avoid future occurrences. Teams must implement corrective actions with due dates, owners, and evidence, not just write a corrective action statement. Connect981 can provide AI-assisted root cause suggestions based on historical NCR patterns, then automatically assign tasks so teams implement corrective and preventive measures with due-date tracking.

    Step 6 – Verification, Closure Criteria, and Timing Discipline

    NCR closure in aerospace is not a checkbox. Teams must verify that corrective actions were implemented, validated for effectiveness, and that affected hardware, paperwork, and systems were updated before closure. Best practices for closing a Non-Conformance Report (NCR) include verifying corrective actions, validating their effectiveness, documenting closure details, obtaining necessary approvals, and archiving the report for future reference.

    Closure criteria should include passing re-inspection or re-test data, updated drawings and work instructions released under configuration control, completed training records, relevant documentation attached, customer approvals where required, and confirmation that CAPA is closed or controlled by verified interim action. The NCR owner verifies objective evidence and recommends closure. The quality manager or MRB chair approves closure. Customer or regulatory representatives sign off when required, for example under specific engine or airframe customer MRB controls.

    Closure timing should vary depending on severity and contractual requirements. Many aerospace teams target minor non conformance closure within 30 days and major non closure within 60 to 90 days, with faster containment windows for high-risk events. AS9100 does not prescribe a fixed day count, but it expects action without undue delay. Aging reports, escalation rules, and owner accountability help ensure compliance, verify compliance, and maintain compliance. Connect981 enforces closure discipline with mandatory fields, automated reminders, dashboards by plant, program, and supplier, and exportable audit trail packages.

    Roles and Responsibilities Across the Aerospace NCR Lifecycle

    A repeatable NCR process depends on clearly defined roles, especially when multiple sites and suppliers contribute to the same aircraft program.

    • Operators and technicians identify non conformance, stop affected work when safe, and initiate the NCR.
    • Inspectors validate the defect, capture measurements, and support quality control.
    • Production supervisors apply containment, authorize station holds, and protect schedule realism.
    • Quality engineers own the NCR record, coordinate investigation, and align quality processes with defined procedures.
    • Quality managers approve classification, escalation, closure, and better quality management practices.
    • MRB members decide disposition and ensure the outcome meets applicable requirements.
    • Manufacturing and MRO engineers define rework, repair, and process changes.
    • Supplier quality manages supplier-related non compliance, SCAR linkage, and supplier CAPA.
    • Program managers monitor schedule, customer commitments, service quality, and resource allocation.

    In MRO, maintenance engineers and reliability teams take a larger role because non conformance may be found on in-service aircraft during inspection, teardown, or heavy check. Proper training is essential so each function knows when to raise, route, escalate, and close an NCR.

    Traceability, Documentation, and Audit Trail Requirements

    Aerospace NCR processes live or die on traceability. Each non conformance must link to parts, serial numbers, lots, heat numbers, work orders, aircraft registrations, process parameters, operator IDs, calibration IDs, drawings, and work instruction revisions. NCR processes create a permanent, auditable paper trail that assists with legal traceability and compliance.

    A robust audit trail records the full history of edits and approvals, photos, test reports, MRB minutes, repair schemes, timestamps for creation, containment, MRB, CAPA linkage, verification, and closure. It also cross-references CAPA, SCAR, customer complaint records, process records, and management review inputs. NCRs serve as critical inputs for quality audits, regulatory inspections, and management reviews, ensuring that quality issues are captured, investigated, and resolved in line with defined procedures.

    This level of traceability supports product quality, regulatory review, and future investigations. FAA guidance for production approval holders emphasizes traceability and control of articles through production and delivery, while EASA rules emphasize reliable record keeping and retention for airworthiness data. See the FAA’s AC 21-43A and EASA’s initial airworthiness rules for context.

    Connecting NCRs to Continuous Improvement in Aerospace

    Nonconformance reports are essential for identifying and addressing deviations from quality standards, and they facilitate continuous improvement by documenting issues and corrective actions taken. Continuous improvement in aerospace manufacturing is driven by analyzing trends in NCR logs to identify weak links in supply chains or assembly lines.

    Aggregated NCR data can reveal repeated minor non conformance in one cell, recurring supplier issues on titanium forgings, rising customer complaints on a specific LRU, or increased rework after a design change. Teams can use those insights to update control plans, revisit PFMEA, launch kaizen activity around high-defect manufacturing processes, and renegotiate supplier quality agreements based on evidence.

    The practical objective is not just to close records. It is to drive continuous improvement, improve customer satisfaction, meet customer expectations, and exceed customer expectations where possible. Corrective actions fix the specific event. Preventive measures and preventive actions reduce the likelihood of future events across similar products, suppliers, or processes.

    Digitalizing the Aerospace NCR Process with Connect981

    Paper NCR packs, spreadsheets, and disconnected QMS or MES records make aerospace nonconformance management slower than it needs to be. Data is retyped, holds are missed, attachments live in file shares, and closure depends on chasing signatures. That creates avoidable risk for quality management, schedule control, and audit readiness.

    Connect981 replaces fragmented NCR handling with an aerospace operations platform designed for connected shopfloor execution and supplier collaboration. Capabilities include digital NCR forms embedded in work instructions, automated routing to MRB and CAPA, ERP and PLM integration for part and configuration data, mobile evidence capture, document control, and dashboards for aging NCRs.

    A diverse aerospace manufacturing team is gathered around aircraft components, intently reviewing a digital workflow on their tablets. They are focused on ensuring compliance with quality management systems and addressing any non-conformance issues through effective corrective and preventive actions.

    The platform’s zero and low-code workflow builder lets teams mirror their existing non conformance procedure, including customer-specific rules, without a full MES replacement. In a quality management system qms environment, that matters because local procedures, OEM clauses, ITAR constraints, and customer approvals often differ by program.

    Connect981 also supports cross-factory and supplier visibility with shared NCR views, controlled access for customer representatives, standardized templates, and non conformance reporting software that preserves high quality standards. The result is a clearer workflow from containment through MRB, CAPA handoff, and disciplined closure.

    To see how Connect981 digitizes the full aerospace NCR process across factories, MRO lines, and suppliers, request a demo.


  • Supplier NCR: Managing Escaped Defects and Supplier Accountability

    Supplier NCR: Managing Escaped Defects and Supplier Accountability

    1. Introduction: What Is a Supplier NCR and Why It Matters in 2026

    A supplier NCR is not just another quality form. In aerospace manufacturing and MRO, it is the controlled record that links an external supplier’s defect to containment, investigation, disposition, and accountability across the supply chain.

    A Nonconformance Report (NCR) is a controlled quality record used to formally document, investigate, and resolve nonconformities identified during any phase of the product or service lifecycle. NCRs are important because they establish a controlled, auditable process for documenting and resolving deviations from specifications, procedures, or regulatory requirements, ensuring compliance with industry standards.

    In plain terms, non conformance is the condition. A non conformance report is the formal record. A supplier NCR is the supplier-quality version of that record, used when the identified non conformance originates with an external provider. For example, if turbine blades delivered in March 2026 arrive with blade tip thickness outside drawing tolerance by +0.005 inches, the issue is not only dimensional. It is a supplier non conformance that needs traceability, containment, supplier response, and disposition.

    Product non-conformance occurs when a product fails to meet specified requirements, standards, or expectations set by design, regulations, or customer needs. Common causes of product non-conformance include deviations from design specifications, quality standards, or customer requirements.

    This article answers the operational questions that matter: when to issue a supplier NCR, how it differs from an internal NCR, what evidence to require from the supplier, and when the issue becomes SCAR or CAPA-like escalation. Connect981 works with aerospace OEMs, Tier 1s, and MRO organizations, so the focus here is practical: escaped defects, supplier accountability, response windows, external traceability, and audit-ready execution.

    2. Supplier NCR vs Internal NCR: Key Differences

    Internal quality issues are usually contained inside one organization’s quality systems. A supplier NCR crosses company boundaries. That changes ownership, evidence, commercial exposure, and the way relevant stakeholders need to coordinate.

    • An internal NCR normally belongs to internal quality assurance, engineering, production, or maintenance teams. A supplier NCR shifts investigation and corrective measures to the external supplier, while the buyer still controls risk management and final disposition.
    • Internal NCRs usually reference internal procedures, travelers, routing records, and work instructions. Supplier NCRs must connect to purchase orders, contracts, supplier quality clauses, Certificates of Conformance, heat lots, inspection records, and sub-tier documentation.
    • Internal defects are often resolved within the factory. Supplier NCRs link quality control to procurement, warranty terms, replacement costs, approved supplier status, and supplier scorecards.
    • Supplier NCRs can affect sourcing decisions. Repeated major non conformance reports may move a supplier into development status, increase inspection requirements, or remove the supplier from the Approved Supplier List.
    • Legal consequences are different. A supplier NCR may support chargebacks, return to vendor decisions, replacement claims, or contract remedies if materials, parts, or services fail to meet agreed standards.
    • Audit readiness is broader. For AS9100 and customer requirements, especially in airline MRO contracts, external evidence must show that the organization controlled non conforming product from suppliers and protected downstream use.
    • Supplier NCRs require clearer record keeping because the traceability boundary sits outside the buyer’s facility. Lot genealogy, calibration records, raw materials history, special process evidence, and sub-tier flowdowns may all be required.
    • Regulatory compliance decreases the likelihood of defects and increases accountability in the supply chain. In practice, this means supplier NCR records must be suitable for customer audits, FAA or EASA review, and contractual documentation requirements.

    3. When to Issue a Supplier NCR: Triggers and Thresholds

    A supplier NCR should not be used for every minor blemish. It should be issued when supplier-origin non compliance meets defined procedures, acceptance criteria, or risk thresholds.

    Quality inspections typically catch flaws during incoming inspection, material handling, or on the production floor. An NCR may be issued when suppliers fail to provide materials, parts, or services that meet the agreed-upon standards, which can stem from various issues such as quality control failures or process deviations.

    Typical supplier NCR triggers include incoming inspection failures. A March 2025 batch of composite panels that fails ultrasonic inspection for delamination should open a supplier NCR if the panels do not meet specified requirements. The same applies to wrong alloy composition, missing material certification, incorrect coating, or heat treatment outside specification.

    A supplier NCR should also be opened for field-found escaped defects traced to a supplier lot. If a hydraulic actuator fails during service and the investigation points to supplier-provided seals from a defined batch, the response should not stop at replacing one unit. Addressing supplier non-conformance promptly is critical to mitigating the risk of product failure and safeguarding end-users, as it can directly cause final product non-conformances if left undetected.

    Repeated minor defects can justify a supplier NCR when they form a trend. For example, three consecutive months above 1,000 ppm for cosmetic damage, burrs, incomplete cure, or packaging damage may indicate process drift. The immediate defect may be minor, but the pattern is quality data that deserves formal review.

    Serious process non compliance found during supplier audits is another trigger. In 2024, an internal audits cycle might uncover undocumented process changes at a machining supplier, unapproved tooling, or use of a sub-tier special processor without approval. Those findings can require a supplier NCR even before defective hardware is found.

    Customer complaints should also feed the supplier NCR workflow. If a customer return, warranty claim, or in-service MRO finding maps back to a supplier part, the organization should address instances through a formal process rather than treat the complaint as an isolated fix.

    Qualitative triggers matter as much as numbers. Any safety hazards, regulatory non compliance, airworthiness concern, or critical characteristic failure should open a supplier NCR regardless of quantity. Quantitative triggers, such as three major supplier NCRs in 12 months, should be written into the QMS so authorized personnel apply them consistently.

    4. The Supplier NCR Process Step-by-Step

    The supplier ncr process follows the same core logic used in ISO 9001 and AS9100 quality management systems, but it adds supplier interaction, external evidence, and commercial accountability. Quality Management Systems (QMS) are essential for ensuring compliance with industry standards and regulations, such as ISO 9001, AS9100, and IATF 16949, which require organizations to manage nonconformities and take corrective actions.

    The nonconformance report process typically includes steps such as detection and reporting, evaluation and classification, root cause analysis, implementation of corrective actions, verification and closure, and follow-up and monitoring. A well-defined Non-Conformance Report (NCR) process is critical within quality management systems as it helps organizations track and manage issues that may arise during the production or implementation of products or services, ultimately supporting continuous improvement.

    1. Detect the issue at receiving, in-process inspection, first article inspection, MRO teardown, or post-delivery feedback. The identified non conformance must be described clearly enough for the supplier to reproduce the concern.
    2. Contain the affected material. Quarantine parts, prevent further use, apply hold tags, and bracket affected serial numbers, lot numbers, work orders, and shipments.
    3. Create the non conformance report ncr. Include supplier name, PO number, part number, serial or lot numbers, drawing revision, requirement violated, defect description, quantity affected, detection source, risk rating, and immediate containment.
    4. Notify relevant stakeholders. Supplier quality, the buyer, program manager, engineering, quality assurance, and sometimes the customer need timely visibility. Many aerospace supplier manuals require acknowledgement or containment response within 24 to 48 hours. Acro’s supplier quality manual, for example, calls for initial containment within 24 hours and longer-term actions within seven calendar days.
    5. Classify risk. Major, minor, and critical categories should reflect product quality, safety, regulatory requirements, customer requirements, and production impact.
    6. Require supplier investigation. Root cause analysis (RCA) is a structured investigation phase used to determine the underlying cause or combination of causes that led to a nonconformance, ensuring that corrective actions address the root cause to prevent recurrence.
    7. Review corrective actions and preventive actions. RCA may involve cross-functional input from various departments such as QA, engineering, production, maintenance, and regulatory affairs, and is performed using validated methodologies like the 5 Whys technique or Ishikawa diagram.
    8. Verify and close. The objective of root cause analysis is not only to resolve the immediate issue but also to identify additional preventive actions for similar processes or areas to prevent future occurrences.

    Quality Management System (QMS) software plays a crucial role in nonconformance management by standardizing workflows, automating routing and approval processes, ensuring version control, and maintaining full traceability of records, which is vital for compliance and quality assurance. In Connect981, this workflow can be digitized across work orders, suppliers, inspection records, and approval steps without replacing the existing ERP or MES.

    An aerospace technician is meticulously inspecting a precision metal component on a clean shop floor, ensuring compliance with quality management systems and specified quality standards. This routine inspection is part of a structured process aimed at addressing quality issues and maintaining product quality in the aerospace industry.

    5. Containment: When It Must Happen at Supplier Level

    Containment in a supplier NCR means immediate action to stop further non conformances from reaching production, MRO, customers, or the field. Local containment at the buyer is necessary, but it is not always enough.

    Supplier-level containment is mandatory when parts have already moved across multiple sites, serialized aerospace hardware has shipped worldwide, the supplier still has work-in-progress in production, or the issue may affect adjacent lots. The purpose is risk mitigation before the defect becomes harder to find.

    Practical supplier containment requirements should include:

    • Require same-day acknowledgement when the issue affects safety, fit, function, or delivery to a customer.
    • Require a 24 to 48 hour interim containment plan, with named owners and affected lot numbers.
    • Stop production when the failure mode suggests the process is still producing suspect parts.
    • Quarantine work-in-progress, finished goods, and stock at the supplier site.
    • Expand inspection to adjacent lots and related part numbers when raw materials, tooling, fixtures, or operators overlap.
    • Temporarily increase inspection frequency, often to 100 percent screening until the process is stable.
    • Require supporting documentation that shows quantity inspected, quantity rejected, serial numbers affected, and disposition status.
    • Confirm whether sub-tier suppliers must also place material on hold.

    A practical example is a 2025 fastener supplier placing a line on hold, quarantining lots 24-031 through 24-037, and re-inspecting 100 percent of inventory within 72 hours. AMETEK supplier requirements similarly emphasize segregating suspect product and submitting containment plans quickly, which reflects how aerospace buyers expect suppliers to control risk.

    6. What Evidence to Require from Suppliers

    Robust quality assurance depends on objective evidence, not reassurance. A supplier response that says “operator error corrected” is not enough for aerospace, MRO, or other regulated industries such as medical device manufacturing.

    The supplier NCR response should require clear evidence categories:

    • Inspection data sets, including nominal values, actual values, tolerance limits, gage IDs, CMM output, and sampling basis.
    • Photos or video of the defect, packaging condition, tooling setup, fixture location, or marking issue.
    • Batch, lot, heat, and raw materials documentation showing traceability to Certificates of Conformance and purchase requirements.
    • Calibration records for inspection equipment and production equipment used to accept the affected product.
    • Traveler sheets, routing records, operator logs, and work instruction revisions that show what process was actually followed.
    • Control charts, capability data, and SPC history for critical or key characteristics.
    • Special process evidence, including NDT, heat treatment, coating, plating, welding, and sub-tier processor approvals.
    • Updated FMEAs, control plans, training records, effective dates, and revised work instructions when process improvement is required.
    • Verification of effectiveness, such as post-correction inspection data, internal audit results, field return monitoring, or stable SPC trends.

    A standard supplier response should follow a structured process: problem statement, containment, root cause analysis, corrective actions, verification of effectiveness, and corrective and preventive actions. For major or safety-related issues, attachments should be required, not optional.

    Digital traceability expectations are high in aerospace. The NCR record should link serial numbers, lot numbers, PO lines, inspection data, supplier documents, and relevant documentation in a document management system. VIRTEX supplier requirements, for example, call for retention of material and inspection records for 10 years unless otherwise specified, which reflects common aerospace documentation practice.

    Medical device manufacturers face similar expectations for medical devices, where evidence, traceability, and documented corrective and preventive activity are required to maintain product quality and ensure quality. The industries differ, but the record discipline is familiar.

    A quality engineer is reviewing precision inspection results next to aerospace components, focusing on quality management systems and ensuring compliance with specified quality standards. The engineer analyzes data to address quality issues and implement corrective actions, contributing to continuous improvement in the supply chain.

    7. Disposition, Escalation, and When a Supplier NCR Becomes a SCAR/CAPA

    Disposition is the formal decision on what happens to the nonconforming material. Common dispositions for non-conforming items include scrap, rework/repair, return to vendor, or use as-is with concessions.

    For supplier non conformances, disposition options usually include use-as-is with engineering justification, rework by supplier, rework by buyer with chargeback, scrap, repair, downgrade, or return to supplier. The decision should be made by authorized personnel, with engineering and quality approval where required.

    Addressing product non-conformance involves identifying and documenting issues, analyzing root causes, notifying stakeholders, and implementing corrective actions to prevent recurrence. The same discipline applies to supplier NCRs, but external accountability must be explicit.

    Escalation to SCAR or CAPA-like control is appropriate when:

    • The supplier has repeated non conformances in a 6 to 12 month period.
    • A defect has critical safety, airworthiness, regulatory compliance, or customer impact.
    • Customer complaints show the defect reached the field or an MRO customer.
    • The supplier misses response windows or provides weak root cause analysis.
    • The supplier cannot show process control, training, calibration, or special process approval.
    • The same underlying cause appears across multiple part numbers or sites.
    • The buyer’s risk assessments show unacceptable recurrence or severity.
    • The issue creates wasted resources, major schedule disruption, or exposure to non compliance.

    A supplier NCR becomes a SCAR when deeper supplier corrective actions are required. SCAR usually demands management review at the supplier, formal root cause, corrective measures, preventive actions, milestone tracking, and effectiveness verification. In many organizations, the SCAR behaves like an external capa process.

    The link to internal CAPA matters. Systemic supplier issues may require internal corrective and preventive review of supplier selection, incoming inspection strategy, contract review, design tolerances, or sourcing policy. A good QMS defines escalation logic, such as three major NCRs in 12 months automatically triggering SCAR, with approval roles and deadlines documented.

    8. Integrating Supplier NCRs with Internal Audits and Customer Feedback

    Supplier NCRs should not live in isolation. They should feed internal audits, supplier reviews, risk registers, customer complaints analysis, and management review.

    During an annual 2025 AS9100 internal audit cycle, auditors should verify that supplier NCRs are issued consistently, contain required evidence, follow response windows, and close only after verification. Internal audits should also test whether corrective actions were implemented and whether recurrence was monitored.

    Audit findings can themselves trigger supplier NCRs. Missing inspection records, undocumented process changes, unapproved sub-tier outsourcing, or weak calibration control all indicate supplier control problems. Even when no defective hardware has been found, the process weakness may justify formal supplier action.

    Customer feedback closes the loop. Field returns, in-service failures, warranty claims, and airline MRO findings should be mapped back to supplier lots when possible. If the supplier origin is confirmed or strongly suspected, the supplier NCR becomes the mechanism to address quality issues and prevent recurrence.

    Trend review is essential. Teams should identify trends by supplier, defect type, response time, containment quality, recurrence rate, and cost of poor quality. This data analysis supports continuous improvement because it shows where supplier development, inspection changes, or sourcing decisions will have the most effect.

    The key components are consistency and follow-through. A supplier NCR that closes without evidence, verification, or monitoring is only administrative closure. It does not improve quality.

    9. Using Supplier NCR Data for Quality Assurance and Competitive Advantage

    Well-structured supplier NCR data supports proactive quality assurance, cost reduction, supplier development, and better sourcing decisions. The NCR process can track vendor defect rates, enforce quality standards, and hold suppliers accountable for replacement costs.

    Useful metrics include the number of supplier NCRs by supplier, defect rate by part family, average response time, containment timeliness, closure cycle time, repeat defect percentage, escaped defects versus caught-at-receipt defects, and cost of poor quality. Mature teams also track whether corrective actions remained effective after 30, 60, or 90 days.

    Supplier scorecards should include both product quality and response behavior. A supplier with a low defect count but poor containment discipline may still be a risk. A supplier with recurring defects but strong root cause analysis and verified process improvement may be a better long-term candidate for development.

    Supplier non-conformance occurs when incoming raw materials or outsourced components fail to meet established design criteria or quality standards, which can lead to operational inefficiencies and increased costs. That data should feed quarterly business reviews, dual-sourcing decisions, preferred supplier status, and targeted supplier audits.

    From 2024 through 2026, aerospace companies have increasingly used AI-assisted analytics to find patterns across ncr data: defect types, tooling, operators, materials, sub-tier suppliers, and late response behavior. The goal is not to replace engineering judgment. The goal is to surface weak signals sooner.

    Digital platforms like Connect981 centralize quality data, integrate it with ERP and MES records, and give teams a shared view across factories and suppliers. The outcome is a practical competitive advantage: fewer disruptions, stronger compliance posture, better customer satisfaction, and stronger successful project execution.

    An aerospace production team is gathered in a factory setting, reviewing components and inspection records, focusing on quality management systems and ensuring compliance with specified quality standards. They are engaged in discussions about non conformance reports and corrective actions to address quality issues and improve product quality.

    10. How Connect981 Supports Supplier NCR Workflows

    Connect981 is a unified aerospace operations platform that helps teams digitize supplier NCR workflows without forcing a full ERP or MES replacement. It connects defect logging, work execution, supplier data, document control, and traceability in one operational layer.

    Teams can configure low-code workflows for supplier NCR initiation, review, approvals, supplier communication, MRB disposition, and escalation. Digital quality checks, defect logging, parts traceability, supplier collaboration, and automated alerts help enforce response windows instead of relying on email threads and spreadsheets.

    For audit readiness, Connect981 links supplier NCR records to work orders, serial numbers, PO data, inspection results, documents, and approval history. That traceability supports AS9100, FAA, EASA, ITAR, and customer audits because the record shows what happened, who approved it, and what evidence was used.

    A practical example: a Tier 1 aerospace supplier using Connect981 to manage more than 200 supplier NCRs in 2025 could reduce average closure time from 30 days to 12 days by standardizing templates, automating notifications, and making supplier evidence visible in one workflow.

    Request a demo to see how supplier NCR workflows run in Connect981.

    11. Practical Checklist: Designing a Robust Supplier NCR Procedure

    • Define when a supplier NCR is required and when a minor issue can be handled locally.
    • Specify thresholds for ppm, repeat defects, customer impact, and safety risk.
    • Map roles for supplier quality, procurement, engineering, quality management, MRB, and program leadership.
    • Require same-day acknowledgement for critical issues and 24 to 48 hour containment response.
    • Define required evidence for inspection, traceability, calibration, process controls, and training.
    • Include clear disposition paths: scrap, rework, repair, return to vendor, and use-as-is concession.
    • Document escalation logic to SCAR, CAPA, and management review.
    • Link supplier NCRs to internal audits, customer complaints, supplier scorecards, and risk reviews.
    • Require external traceability for serial numbers, lots, batches, raw materials, and sub-tier processors.
    • Control non compliance through documented approvals, version control, and closure verification.
    • Ensure documentation is suitable for regulatory and customer audits.
    • Use routine inspections, dashboards, and follow-up monitoring to confirm corrective actions remain effective.

    12. Conclusion

    A disciplined supplier NCR process improves quality control by making supplier-origin defects visible, traceable, and actionable. It protects production, MRO operations, and customers by forcing a clear sequence: containment, evidence, root cause analysis, disposition, corrective actions, verification, and monitoring.

    The distinction matters. Internal NCRs address problems inside the organization. Supplier NCRs manage external accountability across contracts, purchase orders, supplier scorecards, and regulatory expectations. Strong procedures define response windows, evidence requirements, escalation logic, and ownership before a high-risk escape occurs.

    As aerospace and MRO supply chains become more complex through 2030, supplier non conformance management will only become more important. Digitalization with platforms like Connect981 helps teams move beyond spreadsheets and email into a connected, audit-ready supplier NCR process that supports compliance, supplier collaboration, and reliable execution.

  • Manufacturing KPI Dashboard Software: Turning Aerospace Operations Data into Action

    Manufacturing KPI Dashboard Software: Turning Aerospace Operations Data into Action

    Introduction: Why Manufacturing KPI Dashboards Matter in 2026

    In 2026, aerospace and defense manufacturers sit on more production data than ever before, yet many manufacturers struggle to turn that data into confident decisions. Spreadsheets get emailed between departments. MES screens show one version of cycle time. ERP spits out another. A quality engineer pulls first pass yield from a local database while the plant manager cites a different number in a customer review. Manufacturers can lose up to $50 billion annually due to downtime alone, and much of that loss traces back to decisions made on stale or conflicting numbers.

    The problem is not a lack of data. It is a lack of governed, connected, role-based manufacturing kpi dashboard software that standardizes key metrics like overall equipment effectiveness, first pass yield, scrap rates, and cycle time across teams. Manufacturing dashboards provide real-time visibility into production data, but only when built on a foundation of consistent definitions and unified sources.

    Connect 981 is a KPI and analytics platform built specifically for aerospace, MRO, and advanced manufacturing teams who need traceable, reliable dashboards rather than generic BI. It governs KPI definitions, connects existing systems, and turns analytics into practical actions on the shop floor.

    This article covers:

    • Why spreadsheets and disconnected data create reporting drift
    • What manufacturing kpi dashboard software actually is and how it works
    • The key performance indicators every aerospace operation should track
    • How to design effective dashboards for operators, engineers, and executives
    • How Connect 981 helps teams standardize, connect, and act on their data
    • Practical examples, implementation advice, and evaluation criteria

    From Spreadsheets to Manufacturing KPI Dashboards: The Core Problem

    Picture this: an aerospace machining plant misses a delivery window on a titanium engine component. Operations says OEE was on target. Quality reports first pass yield was fine. But when the program manager digs in, they discover that OEE was calculated differently in the MES than in the weekly Excel report, and FPY excluded rework that was quietly handled on the night shift. Manual data collection across disconnected systems created two truths and zero accountability.

    This is reporting drift, and it is endemic in manufacturing operations that rely on traditional methods.

    Common symptoms include:

    • Mismatched definitions for first pass yield across quality and production teams
    • Inconsistent cycle time calculations per cell or line
    • Incomplete inventory management data that hides material constraints
    • Missing supplier performance signals because QMS and ERP are not connected
    • Human error in manual data entry corrupting weekly roll-ups
    • Power BI dashboards built by one analyst with hard-coded filters that no one else understands

    Generic manufacturing dashboards or one-off BI models fail on the factory floor because they have no governance, no standard KPI library, and no direct connection to execution workflows.

    What Is Manufacturing KPI Dashboard Software?

    Manufacturing KPI dashboard software is a governed layer that connects production, quality, maintenance, supply chain, and commercial data into role-based digital dashboards. It goes beyond visualization. Manufacturing KPI dashboard software consolidates production quality and maintenance data into actionable insights by embedding KPI definitions, data governance, alerting, and workflows that trigger actions.

    It centralizes key metrics in one view, providing a broad overview of critical health metrics across the operation. Automated data unification removes the need for manual data entry and analysis, while real-time data integration connects directly to ERP systems, IoT sensors, and shop-floor machinery.

    What makes it different from generic BI tools:

    • Pre-modeled manufacturing analytics concepts (OEE, cycle time, takt time, FPY, scrap) with governed formulas
    • Built-in handling of shifts, lines, part numbers, and serial numbers
    • Support for real time and near-real-time updates
    • Interactive data visualization that transforms raw numbers into intuitive charts, color-coded gauges, and status indicators

    Typical systems it touches: ERP (orders, cost), MES (work orders, machine status), QMS (nonconformances), CMMS (maintenance events), PLM (revision control), CRM, GA4, Google Ads, and Google Search Console for end-to-end visibility. Dashboards act as a central control tower for the production floor, driving operational efficiency from receiving dock to customer shipment.

    The image depicts an aerospace factory floor featuring large wall-mounted monitors that showcase colorful gauges and charts, providing key performance indicators and manufacturing analytics. Below the monitors, precision machining equipment is visible, highlighting the integration of real-time data insights into production processes for improved operational performance and efficiency.

    Key Metrics to Track in Manufacturing KPI Dashboards

    Every serious manufacturing analytics software platform should support these key metrics out of the box, each tied to a data source, a standard formula, and an owner. This prevents the conflicting numbers that erode trust in data driven decisions.

    Production and Equipment KPIs

    Overall equipment effectiveness is the foundational metric for any manufacturing dashboard. OEE combines availability, performance, and quality into a single score. OEE rates typically fall between 40% to 60% in most discrete manufacturing environments. Highly efficient factories aim for an OEE score of 85%. In aerospace, starting points of 50-65% are common due to long changeovers and qualification runs.

    Cycle time measures the duration to transform raw materials into finished products. Tracking true cycle time per part family, including setup and micro-stoppages, through trend lines and distribution charts helps identify bottlenecks that static reports miss. Optimized throughput involves monitoring cycle time and throughput to identify bottlenecks in real time, comparing actual production volume against takt targets per station.

    Mean time between failures and mean time to repair are critical for high-value production equipment like autoclaves, NDT systems, and engine test stands. Predictive maintenance allows teams to predict and resolve equipment failures before unplanned downtime occurs. AI enhances predictive maintenance strategies in manufacturing operations by detecting patterns in machine data that precede failures. Predictive analytics reduces unplanned downtime by anticipating equipment failures before they happen. Real-time dashboards help identify bottlenecks quickly, and tracking machine downtime and scrap rates instantly helps optimize resources for reduced downtime and increased yield.

    Quality and Yield KPIs

    First-pass yield measures the number of quality goods produced without rework or scrap on the first attempt. In aerospace, FPY matters at every critical operation because downstream rework carries enormous cost and schedule penalties. FPY trend charts by program, part number, and supplier lot are essential for continuous improvement.

    The scrap rate indicates the percentage of materials that cannot be recycled or recovered, while rework rate captures recoverable but costly defects. Separating these in stacked bar charts by line, shift, and failure mode drives better cost modeling and root cause analysis.

    Defect per million opportunities measures product quality at a granular level. Companies with a DPMO of 3.4 have efficient production processes, representing Six Sigma performance. AS9100 is a key standard for aerospace quality management, and quality dashboards track defect rates and production quality metrics required for NADCAP and customer audits. Zero Defect Manufacturing supports quality assurance in aerospace, pushing teams toward process controls rather than inspection-based quality.

    The customer reject rate reflects the percentage of products returned by customers. Enhanced quality control helps teams trace issues back to their root cause by monitoring defect rates over time, linking field returns to production batches, lots, and serial numbers.

    Inventory, Supply Chain, and Delivery KPIs

    Inventory turnover and days of supply expose slow-moving inventory, excess WIP, and material constraints common with long-lead aerospace components. Manufacturers can optimize inventory using predictive analytics insights that flag replenishment needs before stockouts occur.

    Supplier quality and OTIF scorecards consolidate defect rate, late delivery percentage, and line-stoppage impact by vendor. Predictive analytics helps identify bottlenecks in production processes caused by supplier delays, giving supply chains early warning. Red-flag tiles for critical part shortages help MRO and production teams prioritize procurement for upcoming work orders.

    Schedule adherence dashboards compare committed versus actual lead times for assemblies and MRO events, with visual slip timelines that make delays obvious.

    Commercial, Sales, and Website Performance KPIs

    Aerospace and advanced manufacturers increasingly need a single manufacturing kpi dashboard that ties operational performance to demand signals and revenue health. Lead volume and lead quality from GA4, Google Ads, and Google Search Console show website visits, form submissions, and search impressions relevant to new program captures. Sales pipeline health from CRM, shown by stage (RFQ, proposal, negotiation, award) and win-rate trends, aligns capacity planning with OEE data.

    Performance tracking by tracking specific KPIs can improve speed, quality, and flexibility across the business. Enhanced visibility and accountability improves transparency for specific targets like production output per hour, linking what happens on the shop floor to what the customer experiences.

    How Manufacturing KPI Dashboard Software Works Under the Hood

    The architecture behind effective kpi dashboards follows a layered approach:

    • Data ingestion: connectors pull from ERP, MES, QMS, CMMS, PLM, CRM, GA4, Google Business Profile, and other sources. Aerospace metrics dashboards integrate ERP, MES, and QMS data into a unified stream. Digital dashboards connect shop floor processes to backend systems without requiring a full platform replacement.
    • Governed semantic layer: one shared definition for OEE, FPY, cycle time, and OTIF used everywhere. Changes are versioned and documented. Data integration reduces manual work and errors in manufacturing by enforcing consistency.
    • Visualization engine: role-based manufacturing dashboards generated for operators, supervisors, quality managers, supply chain, sales, and executives. Real-time data insights improve decision-making in manufacturing by presenting relevant information at the right cadence.
    • Workflow and alerting: automated alerting and reporting sends automatic alerts when KPIs fall below predefined thresholds, triggering corrective action workflows.

    Key architectural considerations for aerospace:

    • Latency: operators need updates every 1-5 minutes; supervisors per shift; executives daily or weekly
    • Historical data analysis and trending features allow comparison of current performance against past performance
    • Drill-down capability allows users to explore high-level aggregate data for specific granular details
    • Customization and scalability allow dashboards to be tailored to specific evolving business processes
    • Audit trails log every KPI change, definition update, and threshold breach for AS9100 and FAA compliance
    • Automated reporting reduces manual work and errors in manufacturing reporting cycles

    Designing Effective Manufacturing Dashboards for Different Roles

    The same manufacturing kpi dashboard software must present different windows for different job roles, all drawing from the same governed data model. Layout density, refresh rate, and information scope change depending on whether someone is at the machine, in a daily standup, or in a quarterly review.

    Operators and Cell Supervisors

    Near real time manufacturing dashboards at the line show big-number tiles for OEE, FPY, current cycle time versus target, and active alarms. These use minimal navigation, large fonts, and color-coding for pass/fail. Real-time data access allows operators to identify and resolve issues instantly. Action buttons like “log defect” or “request maintenance” trigger workflows directly from the dashboard. Operators see only the KPIs they directly influence per shift.

    Customizable role-based views allow different stakeholders to see relevant data for their roles without being overwhelmed by information meant for other teams.

    Manufacturing Engineers, Quality, and Continuous Improvement Teams

    These dashboards feature deeper trend lines, control charts, and Pareto analyses of downtime, scrap, and first pass yield by cell, program, and part revision. Dashboards help identify bottlenecks and improve operational efficiency through filters and drill-downs from factory-level OEE to individual machine cycles. Real-time data from dashboards supports data driven decision making for process improvement initiatives like root cause analysis for chronic defects and correlating cycle time variation with defect spikes.

    Plant Managers, Program Managers, and Executives

    Control-tower manufacturing dashboards aggregate multiple plants, suppliers, and programs with KPIs for delivery, quality, cost, and safety. Automated dashboards display KPIs transparently across the organization to improve accountability. Data-driven accountability aligns operators and executives around common goals through shared performance metrics.

    Executives need fewer metrics but stronger storytelling: at most 10-15 top KPIs with red/amber/green status and drill-through to root causes. Cross-domain tiles place on-time delivery next to website lead volume, sales pipeline, and supplier performance to link strategy with operations. Dashboards can be customized for different user roles and needs.

    An industrial operations manager is standing near aerospace component assembly stations, reviewing complex production data on a tablet device. The scene highlights the use of manufacturing analytics software to monitor key performance indicators and improve operational efficiency in the manufacturing industry.

    Why Generic Dashboards and BI Tools Aren’t Enough for Aerospace Manufacturing

    Tools like power bi, Tableau, or generic kpi dashboards excel at visualization but require heavy modeling and governance work that most plants never finish. Manufacturing dashboards integrate data from machines and sensors, but generic tools lack built-in awareness of shifts, routings, serial numbers, quality states, and regulated documentation.

    Common limitations:

    • Hard-coded measures that drift over time as data analysts leave or change roles
    • One-off dashboards per department with no unified KPI catalog
    • No trigger or alert workflows; dashboards remain passive displays
    • Weak traceability back to specific work orders or serial numbers

    When two teams present different FPY numbers to a customer or auditor because they used different filters in separate BI reports, the credibility damage is immediate and lasting.

    Specialized manufacturing analytics software platforms like Connect 981 close this gap by embedding KPI governance, operational context, and workflow into the dashboard layer.

    How Connect 981 Supports Manufacturing KPI Dashboards

    Connect 981 is a unified operations and analytics layer for aerospace manufacturing and MRO that governs KPIs across production, quality, supply chain, and commercial teams. Manufacturing dashboards provide real-time visibility across operations by connecting to existing systems at a governed layer without forcing a rip-and-replace of legacy infrastructure.

    The platform is built around aerospace realities: digital work instructions, parts traceability, serial number management, inspection workflows, and AS9100, FAA, and EASA audit readiness. Real-time data from predictive analytics improves decision-making speed across every level of the organization.

    Governed KPI Definitions Across Operations

    Connect 981 centralizes KPI definitions for OEE, FPY, cycle time, scrap rate, OTIF, inventory turns, and more in a shared catalog. Changes to formulas are versioned, documented, and applied consistently across all manufacturing dashboards and kpi reports. During audits and customer reviews, teams demonstrate exactly how pass yield or defect rates are calculated for a given period. This governance eliminates reporting drift where each department builds its own spreadsheet logic for the same metric.

    Connecting Data Sources Without Rebuilding Your Stack

    Connect 981 sits above existing systems, pulling data from ERP (orders, BOMs, costs), MES (work orders, machine performance), QMS (NCs, CAPAs), CMMS (maintenance events), and commercial tools (CRM, GA4, Google Ads exports). The platform normalizes identifiers like work order numbers, part numbers, serial numbers, and supplier codes so KPIs span systems seamlessly. Integration is configurable with minimal IT overhead compared to full MES replacement projects.

    Role-Based Manufacturing Dashboards and Templates

    Connect 981 provides template dashboards for common aerospace roles: operator line boards, quality dashboards, supplier scorecards, plant-wide OEE views, and executive control towers. Templates include best-practice metric sets for aerospace and MRO, such as FPY by operation, turnaround time for MRO work packages, and documentation readiness for flight releases. Teams adapt layouts via low-code configuration without changing underlying KPI formulas, preserving governance.

    From Insight to Action: Workflows Triggered by KPI Changes

    Connect 981 dashboards are not passive. They tie to workflows and alerts triggered when KPIs cross thresholds: FPY below target on a key operation, cycle time exceeding takt for a high-priority contract, or MRO turnaround time at risk.

    Use cases include:

    • Automatically opening a quality investigation from a dashboard tile
    • Launching a supplier escalation from a scorecard when defect rate spikes
    • Initiating a capacity review when website and CRM metrics signal demand growth

    AI-assisted root cause analysis lets users ask why FPY dropped on a particular program and see contributing factors like supplier changes, shift patterns, or new revision introductions. Every action is logged, supporting compliance, audits, and continuous improvement reviews.

    Practical Examples: Manufacturing Dashboards Built with Connect 981

    Example 1: Plant-Level OEE and FPY Dashboard for an Aerospace Machining Cell

    A machining facility tracks OEE by machine, FPY by operation, and cycle time distribution for titanium components. Connect 981 combines MES machine data, quality inspection records, and tool-change events to highlight a specific spindle causing repeated FPY dips. Maintenance and process engineering trigger a corrective action workflow from the dashboard, document the fix, and track KPI improvement over subsequent weeks, replacing the weekly spreadsheet roll-ups that previously delayed action by days.

    Example 2: MRO Turnaround Time and Parts Availability Dashboard

    An MRO operation tracking landing gear overhaul TAT uses dashboards breaking lead time into waiting for parts, work in progress, and QA sign-off. Connect 981 correlates ERP purchase orders, inventory signals, and shopfloor task completion to separate material-induced delays from process-induced delays. A stacked timeline per work package shows red segments for delays, with KPIs for average TAT, late jobs, and parts availability heatmaps, helping prioritize procurement actions for upcoming maintenance windows.

    Example 3: Supplier Performance and Cost-of-Quality Dashboard

    A dashboard consolidates supplier defect rates, OTIF, and associated scrap/rework costs for key metallic and composite suppliers. Connect 981 ties QMS nonconformances, ERP cost data, and supplier codes into a unified view for quarterly business reviews. Users drill from a high-level supplier scorecard to part-level defect Pareto charts and batch-level history. The result: earlier issue detection, stronger supplier negotiations, and fewer line-stopping events.

    Example 4: Linking Website, Sales Pipeline, and Capacity Dashboards

    A cross-functional dashboard brings together website traffic from GA4, RFQ submissions, pipeline value from CRM, and available capacity from OEE and cycle time models. An aerospace supplier uses this to forecast staffing and machine investment as new programs ramp, rather than reacting mid-contract. The same governed KPIs feed executive reviews, replacing separate slide decks from marketing, sales, and operations that previously showed conflicting numbers. Connect 981 brings external digital signals and internal factory metrics into one governed kpi dashboard to support complete visibility and informed decision making.

    The image depicts a spacious modern aerospace maintenance hangar filled with aircraft components on work stands, where technicians are actively collaborating on various tasks. This environment highlights the importance of real-time data insights and key performance indicators in the manufacturing industry to enhance operational efficiency and improve production processes.

    Implementation Considerations: Getting Value from Manufacturing KPI Dashboard Software

    Start with critical use cases rather than trying to digitize everything at once. An FPY improvement program on one cell or a TAT reduction initiative in one MRO bay gives you a focused pilot with measurable results.

    Practical steps:

    • Establish a KPI governance group with representatives from operations, quality, supply chain, and IT to own metric definitions
    • Clean up master data: part numbers, routing steps, supplier codes, and shift definitions
    • Validate historical baselines before going live so dashboards show meaningful insights from day one
    • Train teams to use dashboards in daily standups, shift handovers, and supplier reviews, not just monthly reports
    • Automated reporting helps maintain compliance with quality standards by ensuring consistent, traceable outputs

    Connect 981 is designed for fast rollout with low-code configuration, drag-and-drop templates, and minimal IT overhead, making it practical for organizations still relying heavily on spreadsheets and paper.

    Evaluating Manufacturing Analytics Software: How Connect 981 Compares

    When selecting manufacturing analytics software in 2026, evaluate against these criteria:

    Criteria

    Generic BI Tools

    Machine Monitoring Only

    Connect 981

    Aerospace data model

    No

    Partial

    Yes

    Governed KPI catalog

    Manual setup

    No

    Built-in

    Serial number traceability

    No

    No

    Yes

    Workflow triggers from dashboards

    No

    Limited

    Yes

    Supplier collaboration

    No

    No

    Yes

    Commercial + ops in one view

    Possible with effort

    No

    Yes

    Speed of deployment

    Weeks to months

    Days

    Days to weeks

    Connect 981 is not just another dashboard tool. It combines manufacturing analytics, digital work instructions, shopfloor execution, and governed kpi dashboards in one layer. Ask yourself whether your current dashboards can answer multi-system questions like “Which suppliers most affect FPY on our top program?” as readily as a purpose-built platform.

    Next Steps: Bringing Your Manufacturing KPIs into One Governed Dashboard

    Manufacturers need more than charts. They need governed manufacturing kpi dashboard software that ties data, definitions, and actions together into a unified view. The benefits are concrete: standard KPIs, reduced reporting drift, smarter decisions, faster root cause analysis, and cross-team alignment from the shop floor to the C-suite.

    Here is a starting plan:

    1. Pick one plant or program
    2. Choose 10-15 critical KPIs (OEE, FPY, cycle time, TAT, supplier quality, pipeline health, defect rate)
    3. Pilot a unified manufacturing dashboard with governed definitions
    4. Expand based on results

    If your teams are still reconciling spreadsheets, debating KPI definitions in meetings, or building dashboards that no one trusts, it is worth evaluating Connect 981. The platform sits on top of your existing ERP, MES, QMS, CRM, and digital analytics stack without requiring a rebuild. Request a demo to see how it works with your data, your metrics, and your operational reality.

    The path from scattered reports to a governed manufacturing analytics environment does not require replacing everything. It requires connecting what you already have and governing it properly. That is what Connect 981 was built to do.

  • NCR Template: Practical Fields, Evidence, and Audit‑Ready Traceability

    NCR Template: Practical Fields, Evidence, and Audit‑Ready Traceability

    In aerospace manufacturing and MRO, a non conformance report is not just a quality form. It is a controlled quality record used to formally document, investigate, and resolve nonconformities identified during any phase of the product or service lifecycle.

    Nonconformance reports are essential for documenting deviations from specifications, procedures, or regulatory requirements, ensuring that quality issues are formally identified and addressed. Manufacturing and production sectors utilize NCRs to flag defective materials, assembly errors, or machinery malfunctions. In aerospace, that same discipline supports AS9100, FAA, EASA, customer, and program requirements.

    This guide explains what belongs in an NCR template, what evidence should be attached, and how an ncr record should be closed so it can withstand external audit review. Examples include nonconforming turbine blade machining in March 2026 and MRO inspection findings on A320 landing gear.

    Connect981, also known as C-981, provides digital NCR templates and workflows that connect shopfloor, engineering, quality control, and suppliers in a single ncr process.

    An inspector is closely examining an aircraft component on a clean maintenance bench, ensuring compliance with regulatory requirements and quality standards. The inspection process is part of a quality management system aimed at identifying any non-conformance and implementing corrective actions to maintain service quality.

    What Is an NCR Template? (Definition and Purpose)

    An NCR template is a standard, controlled layout for capturing every required piece of information about a non conformance in production, MRO, supplier quality, or service quality. An NCR template standardizes how organizations document, track, and resolve deviations from quality standards.

    The template is the data structure. The ncr process is the workflow: detection and reporting, evaluation and classification, root cause analysis, implementation of corrective actions, verification and closure, and follow-up and monitoring. Both must align with the quality management system, defined procedures, customer obligations, and regulatory requirements.

    A good nonconformance report template prevents missing quality data. It forces a clear description, requirement reference, acceptance criteria, immediate containment, disposition, root cause, corrective and preventive actions, closure verification, and sign off.

    There is also an older meaning to NCR. NCR paper is coated with micro-encapsulated dye and a reactive clay that create copies when pressure is applied. In that context, an NCR template is a digital layout used to print multi-part forms that duplicate writing without carbon paper. In this article, ncr template means the quality management form used to control nonconforming material and process deviation records.

    NCRs support compliance with various industry standards and regulations, including ISO 9001, AS9100, and FDA requirements, by providing documented evidence of quality issue resolution. Nonconformance reports are essential for compliance with industry standards and regulations, such as ISO 9001, AS9100, and FDA regulations, which require organizations to manage nonconformities and take corrective action. NCRs also serve as compliance records for government audits and risk mitigation in medical devices and pharmaceuticals. For aerospace, AS9100 clause 8.7 on control of nonconforming outputs is a useful anchor point; see the IAQG 9100 series overview.

    NCRs can be customized and standardized for different organizations, allowing for various templates that fit specific departmental needs, such as simple one-page reports for smaller organizations or extensive reports for larger organizations with compliance requirements.

    Core Sections of an NCR Template (Field-by-Field Guide)

    Every ncr form should contain these core sections, whether it is Word, Excel, paper, eQMS, or a digital workflow:

    • Unique report number, location, work order, date, and ncr status.
    • Problem description and non conformance description.
    • Non conformance type and standard violated.
    • Requirement reference, specifications, and acceptance criteria.
    • Risk, severity, and potential impact.
    • Immediate action, immediate corrections, containment, and affected process.
    • Root cause and root cause analysis.
    • Corrective actions, preventive action, and corrective and preventive actions.
    • Disposition, verification, closure evidence, and closure verification.

    Key sections of an NCR template include unique report number, problem description, standard violated, immediate action, root cause analysis, and corrective/preventive action. A Nonconformance Report includes key components such as a clear description of the nonconformance, the type of nonconformance, a reference to the unmet requirement, associated risk level, immediate containment actions, and disposition decisions.

    The structure of a nonconformance report typically includes sections for identification, location and work description, non-conformance description, requirement references, immediate action or containment, contractor response, engineer disposition, and verification and closure. If any of these fields are missing, the report is easier to challenge during an AS9100 or customer audit.

    1. NCR Identification and Context

    Strong identification is the backbone of traceability and later trend analysis. The template should include:

    • Unique NCR number, such as NCR-A320-MRO-2026-0142.
    • Site, line, cell, station, aircraft tail number, or MRO bay.
    • Manufacturing order, MRO work package, repair order, service bulletin, or PO.
    • Date and time raised.
    • Reporter name, function, department, and role.
    • Internal or supplier origin flag.

    For supplier issues, include supplier name, supplier code, PO number, contract number, delivery note, and supplier certificate reference. These fields link directly to process records and relevant documentation.

    2. Non Conformance Description (Facts, Not Opinions)

    The non conformance description must be factual. It should identify what was observed, where it was found, and how it failed to meet specific requirements. It should not speculate about human error or blame.

    A strong example: “Flap track pin diameter measured 15.94 mm versus specified 16.00 ±0.02 mm on PN FT-23-195, SN 23-981-047, measured on 18 Mar 2026 at Station B using CMM-05.”

    Required fields include part number, serial number, lot or batch, configuration revision, process step, aircraft registration if relevant, and measurement method. NCR documentation must include a clear, objective summary of the defect or deviation and the immediate steps taken to isolate affected products.

    3. Requirement References and Acceptance Criteria

    This is the most important part of turning an observation into a defensible non conformity report. The template must force at least one hard reference:

    • Drawing number and revision.
    • Specification clause.
    • Repair manual task.
    • Work instruction ID.
    • Customer requirement ID.
    • AS9102 first article inspection reference, when applicable.
    • OEM service bulletin or procedure number.

    Examples: “Drawing 981-TRB-110 Rev F, note 7” or “CMM 77-21-01, task 301, allowable corrosion depth 0.25 mm max.” Without a requirement reference, the NCR becomes an opinion rather than objective evidence.

    4. Detection Details and Audit Trail Hooks

    The template should capture when and how the issue was detected:

    • Incoming inspection, in-process inspection, final inspection, MRO inspection, automated vision check, operator observation, audit finding, or customer complaint.
    • Equipment ID, such as CMM-03 or torque wrench TW-12.
    • Last calibration date and calibration certificate number.
    • Linked inspection report, test log, maintenance log, or customer defect report.

    These fields create the early audit trail. In Connect981, several can be auto-populated from ERP, MES, inspection, and work order systems, reducing manual entry errors and protecting data continuity.

    Risk, Severity, and Scope Fields in the NCR Template

    Non-Conformance Reports can be classified into different types based on their severity, including minor and major non-conformance reports, which reflect the impact of the non-conformance on the product, service, or process.

    A strong ncr template includes severity rating, probability or occurrence, risk score if used, and regulatory-impact flag. Severity should consider flight safety, airworthiness, delivery impact, customer escape risk, and compliance exposure.

    Scope fields are equally important. The template must force bracketing: how many units, which lots, which serial numbers, and whether shipped assemblies may be affected. Poor scope definition can turn systemic issues into a false one-off.

    Severity and Classification Fields

    Use a standard dropdown or scale: Minor, Major, Critical. Minor Non-Conformance Reports typically address less severe issues that have a lower impact and can be corrected easily, while Major Non-Conformance Reports involve significant violations that require extensive corrective actions and communication with management.

    Examples:

    • minor non conformance: paint shade variance outside cosmetic requirement.
    • Major: dimensional out-of-tolerance condition on a structural bracket.
    • Critical: suspected unapproved part in a 737NG spoiler repair.

    For MRO, add fields for airworthiness impact, MEL or CDL relevance, and engineering authorization. Consistent classification improves trend analysis and management review.

    Scope and Impacted Items

    Scope fields should include quantity affected, serial numbers, tail numbers, production dates, work order range, and lot genealogy. Add checkboxes for:

    • Confined to single unit.
    • Multiple units affected.
    • Unknown, investigation required.
    • Shipped product potentially affected.

    Example: 50 titanium fasteners received on 02 Feb 2026 fail hardness requirements. The ncr data must show which engine builds used the lot, which units remain in stores, and which assemblies require re inspection.

    A technician is carefully measuring a machined aerospace part using precision equipment, ensuring adherence to quality standards and regulatory compliance. This process is essential for identifying any non conformities and implementing corrective actions to maintain service quality and continuous improvement.

    Containment, Correction, and Disposition Fields

    Containment, correction, and disposition are different decisions. Immediate containment controls risk now. Short-term correction addresses already-touched units. Final disposition determines what happens to each item.

    Auditors expect proof that nonconforming product or work was controlled. The template should show whether the job was stopped, stock was quarantined, ERP or MES holds were applied, and relevant stakeholders were notified.

    In digital systems like Connect981, disposition fields can block production movement until the required authority approves the next process step.

    Immediate Containment and Short-Term Correction

    The template should include:

    • Work stopped? Yes or no.
    • Material quarantined? Yes or no.
    • Hold tag, cage, bin, or location ID.
    • Temporary controls implemented.
    • Authorized by, with date and time.
    • Units already affected and immediate corrections completed.

    Example: a torque wrench is found overdue for calibration. The tool is suspended, all fasteners installed since 01 Apr 2026 are placed under review, and any suspect installation is rechecked against specifications. “Fixed issue” is not enough. The correction must be concrete and verifiable.

    Disposition Options and Approval

    Standard disposition choices include:

    • Rework to meet spec.
    • Repair under approved engineering disposition.
    • Scrap.
    • use as is with documented justification.
    • Return to supplier.
    • Customer-defined concession.

    Each disposition requires named approval, date, technical justification, and reference to any deviation, concession, MRB record, or customer approval. Example: “Accept under MRB concession MRB-2026-078 with revised allowable blend radius per OEM approval.”

    The template must allow split disposition when one lot is divided: some parts reworked, some scrapped, some returned. If a repair or concession changes configuration, the serialized record must not be left unchanged; the build record, markings, or PLM reference must be updated.

    Root Cause, Corrective, and Preventive Actions (CAPA-Ready Fields)

    A strong template separates symptom, root cause, corrective actions, and preventive action. NCR templates are designed to capture essential information such as the nature of the nonconformance, corrective actions taken, and preventive measures to avoid recurrence, ensuring compliance with quality management system requirements.

    For major or recurring issues, the NCR should link to the capa process, corrective action process, CAPA ID, SCAR, or formal risk assessment. Connect981 can initiate CAPA workflows when severity, recurrence, or supplier thresholds are met.

    Nonconformance reports help organizations identify and analyze recurring issues, which can lead to the implementation of preventive actions to avoid future nonconformities.

    Root Cause Analysis Field Design

    The root cause field should be separate from the non conformance description. It should capture contributing factors such as method, machine, material, manpower, environment, and measurement.

    Good example: “Outdated CNC program Rev B used after engineering released Rev D; program control process did not require shopfloor verification of current revision.”

    Add a field for investigation method: informal review, 5 Whys, fishbone, or full investigation. Generic “operator error” should be rejected unless evidence shows why the system allowed the error.

    Corrective and Preventive Action Planning Fields

    Corrective action fields should include action description, owner, target dates, resources, implementation date, and verification method. Preventive action fields should address broader controls that prevent recurrence across similar parts, suppliers, programs, or work centers.

    Examples include updating torque procedures, revising supplier acceptance criteria, adding barcode checks, or changing work instruction revision controls. By documenting nonconformities and their root causes, organizations can implement corrective and preventive actions (CAPA) that address the underlying issues, thereby reducing the likelihood of recurrence.

    Evidence, Attachments, and Traceability Requirements

    An NCR without objective evidence is weak. Typical attachments include photos, dimensional reports, NDT results, material test reports, calibration certificates, MES logs, supplier certificates of conformity, and inspection records.

    The template should list each attachment with filename, ID, revision, storage location, and owner. To ensure complete data collection, an NCR must document details such as evidence of defects and sign-offs for verification.

    Traceability means a reviewer can reconstruct exactly what happened, to which part, when, by whom, and under which requirement. Connect981 supports drag-and-drop uploads, version control, and linked evidence so the ncr record is not split across emails and file shares.

    The image depicts aerospace parts meticulously arranged in a clean industrial workspace, ready for receiving inspection to ensure compliance with quality standards. This setup emphasizes the importance of quality management systems and the need for relevant documentation to verify the acceptance criteria and prevent nonconformance.

    Audit Trail and Revision History Fields

    An audit trail should capture who created, edited, reviewed, dispositioned, verified, and closed the NCR. It should include timestamps for raised, contained, dispositioned, corrective actions completed, verified, and closed.

    Regulated aerospace environments should prevent silent overwrites. Updates need a reason for change, prior value, new value, and user identity. In Connect981, these events are system-generated and exportable for AS9100, customer, FAA, or EASA audit review.

    If the audit history is unreliable, the technical content may still be questioned.

    Internal vs Supplier NCR Templates (What Changes?)

    Internal NCRs apply to shopfloor processes, in-house MRO work, tooling issues, documentation errors, and internal production quality problems. Supplier NCRs apply to incoming material, outsourced special processes, external repair stations, or supplier documentation gaps.

    Both share a common core. Supplier templates add supplier code, PO, contract, delivery note, certificate of conformity, supplier NCR number, 8D reference, and response due date.

    Supplier NCRs may link to SCARs, scorecards, and sourcing decisions. The fields can vary depending on customer requirements, product criticality, and regulatory compliance impact.

    Coordinating Supplier Corrective Actions and Internal Records

    Supplier response fields should include supplier root cause, corrective actions, preventive actions, completion dates, and supplier verification evidence. Internal quality should accept, reject, or return the response with comments.

    Add fields for multi-program impact and impact on other customers when shared suppliers are involved. Keeping supplier answers in the same system reduces email-driven data loss and improves supplier collaboration.

    What Makes an NCR Weak vs Audit-Ready?

    Weak NCRs usually have the same pattern:

    • Vague description such as “dimension wrong.”
    • No requirement reference or acceptance criteria.
    • Missing severity, risk, or scope.
    • No containment record.
    • Disposition not approved.
    • “use as is” without engineering justification.
    • Root cause listed as human error without systemic analysis.
    • No closure evidence or verification.
    • Attachments missing or stored outside the record.

    Strong NCRs include measurable facts, named approvers, linked specifications, objective evidence, complete audit trail, and closure verification that can verify effectiveness.

    Weak example: “Paint peeling on A320 flap track. Repainted.”Audit-ready example: “Paint finish on A320 LT flap track PN FT-23-195, SN 14579, per PS-105 Rev C, found 15 Mar 2026 during final inspection. Delta E measured 4.5 versus required ≤3. Supplier batch 002345 quarantined. Disposition: rework per WP-05. Verification: next 10 parts measured within limit. Closed with QA sign off.”

    The effective use of NCRs can lead to improved product quality, reduced operational costs, and enhanced compliance with regulatory requirements, ultimately preventing customer complaints and operational inefficiencies. NCRs serve as critical inputs for continuous improvement programs, allowing organizations to analyze trends and implement preventive measures that enhance overall quality and compliance.

    Checklist: Quick Review Before Closing an NCR

    Before closure, confirm:

    • Is the unique NCR number, location, date, part, serial, lot, and configuration complete?
    • Is the description factual and measurable?
    • Is the requirement reference documented?
    • Is severity set and justified?
    • Is scope bracketed across affected units and shipped product?
    • Is containment documented with owner and date?
    • Is disposition approved by the authorized role?
    • Are corrective actions assigned with target dates?
    • Is preventive action defined where needed?
    • Are photos, reports, certificates, and process records attached?
    • Did re inspection or test data verify effectiveness?
    • Is closure evidence complete and sign off recorded?

    This checklist should be part of daily quality review, not just audit preparation.

    Designing and Using an NCR Template in Connect981

    A digital NCR template in Connect981 differs from static forms because required fields, routing, approvals, supplier access, and role-based visibility are built into the workflow. Teams can configure internal, supplier, and MRO templates with zero or low-code tools.

    Connect981 links NCRs to work orders, serial numbers, digital work instructions, supplier records, CAPA workflows, and dashboards. Results feed management review, recurrence metrics, time-to-containment, supplier performance, and minor versus major non conformance trends.

    The outcome is practical: better quality, stronger compliance, less manual reporting, and clearer decisions at the point of work. Request a Demo of Connect981 to see NCR templates, supplier workflows, and audit-ready traceability in a live aerospace context.

  • NCR vs MRB vs CAPA: How They Work Together in Aerospace Quality Workflows

    NCR vs MRB vs CAPA: How They Work Together in Aerospace Quality Workflows

    In real aerospace operations, NCR, MRB, and CAPA are not isolated quality terms. They are connected handoffs in the same quality control process, moving from defect detection to product disposition to systemic improvement.

    The practical sequence is simple: Detect → NCR → MRB → sometimes CAPA → closure and learning. The value comes from knowing where each step starts, where it stops, and when the next step becomes necessary.

    1. Overview: NCR vs MRB vs CAPA in One Workflow (Answer the Query Fast)

    In quality management, an NCR documents defects, the MRB evaluates non-conforming materials, and the CAPA addresses underlying causes. That is the cleanest way to understand ncr vs mrb vs capa in aerospace manufacturing and MRO.

    NCR is the first formal record when a nonconforming product, process deviation, or documentation issue fails a requirement. MRB is where a cross functional team determines what to do with that specific material. CAPA is the structured system used to determine root cause, take corrective actions, add preventive action where needed, and prevent recurrence.

    NCR, MRB, and CAPA are interconnected quality management frameworks designed to manage product or process defects. In AS9100, FAA, and EASA environments, this workflow must be well defined, documented, risk based, and supported by objective evidence. Connect981, also known as C-981, supports all three in one system so quality, production, engineering, and suppliers can see the same NCR → MRB → CAPA chain.

    An aerospace technician is carefully inspecting a metallic aircraft component on a clean shop floor, emphasizing the importance of quality control processes and risk management in aerospace manufacturing. This thorough investigation is crucial for ensuring high-quality products and addressing any potential quality issues effectively.

    2. Core Definitions in Service of Workflow Clarity

    Definitions matter only if they clarify the workflow. The question is not “what does each acronym mean?” The better question is: what does each step control, and when does the work move forward?

    2.1 NCR: The Trigger Point in the Quality Workflow

    Nonconformance Reporting (NCR) is a critical process in quality management systems that helps organizations identify and document deviations from expected standards or specifications. NCRs are opened whenever a nonconforming product, process problem, or documentation gap is detected against customer requirements, a drawing, a contract clause, or a quality standard.

    An NCR might capture a mis-drilled hole pattern on a 737 wing rib found on 12 March 2024 during in-process inspection. It might capture incorrect heat-treatment certification from a supplier on a landing gear forging at incoming inspection. It might also come from final inspection, MRO teardown, internal audits, customer complaints, or field returns.

    A useful NCR includes part number, serial or lot number, work order, specification, defect description, immediate actions, containment status, and risk assessment flag. In many organizations, NCRs originate in ERP, MES, QMS, email, or paper. Connect981 can centralize these inputs so quality data is not lost before the next decision point.

    2.2 MRB: Structured Disposition for the Specific Nonconforming Material

    The material review board is the cross-functional decision forum that evaluates the NCR record and the affected product. The MRB is a cross-functional team that decides what to do with non-conforming material that cannot be easily fixed.

    The MRB determines the fate of defective items through actions such as scrapping, reworking, or returning to the vendor. Common mrb decisions include rework to drawing, repair through approved data, use-as-is with documented risk justification, scrap, or return to supplier.

    The MRB question is narrow and practical: what can be safely done with this hardware now? It is not a full systemic investigation. MRB decisions focus on safety, airworthiness, fit, form, function, traceability, and whether customer or OEM approval is required.

    2.3 CAPA: Systemic Corrective and Preventive Actions

    CAPA stands for ‘corrective and preventive action’, which is a systematic approach used in regulated industries to identify, investigate, and address problems or non-conformities in products, processes, and systems. The practical capa meaning is this: CAPA changes the system so the same failure mode is less likely to happen again.

    The capa process is opened when repeat NCRs, serious risk, audit findings, supplier trends, or customer feedback suggest a systemic problem. A robust CAPA process should include steps for creating a CAPA request, reviewing it, initiating it formally, investigating the root cause, and verifying the effectiveness of the actions taken.

    Effective CAPA management requires a cross-functional team to oversee the investigation and resolution of issues, ensuring that all relevant perspectives are considered. That team must approve capa actions, maintain capa records, and confirm capa effectiveness through a verification step, not just implementation evidence.

    The CAPA process is crucial for maintaining compliance with quality management system standards, such as ISO 9001, and is often evaluated during external audits. In aerospace and medical devices, a robust quality management system (QMS) is essential for ensuring compliance with industry standards and regulations, particularly where adherence to standards like AS9100 and ISO 13485 is critical.

    Quality management systems must include clear documentation and control processes to ensure that all procedures are followed and that changes are properly managed throughout the product lifecycle. Continuous improvement is a key principle of quality management systems, which involves regularly assessing and refining processes based on internal audits and customer feedback to enhance product quality and compliance.

    3. The Actual Sequence: From Detection to NCR, MRB, and (Sometimes) CAPA

    The order is operational, not theoretical. An operator, inspector, supplier quality engineer, or MRO technician detects an issue. The immediate issue is contained. The NCR is created. The MRB decides the product disposition. Then the organization determines whether a formal capa is required.

    Sequence diagram logic: Operator → NCR → MRB → CAPA or No CAPA → updated procedures, training, risk files, and closure.

    Key steps:

    1. Detect an issue on the shopfloor, at receiving, during test, in the field, or during MRO.
    2. Contain the affected product and document the NCR.
    3. Route the NCR to MRB for technical evaluation and disposition.
    4. Determine whether the event is isolated or systemic using trends, risk analysis, recurrence, and customer impact.
    5. If needed, open a CAPA investigation with root cause analysis and an action plan.
    6. Close the loop by confirming MRB disposition, verifying CAPA effectiveness, and updating control plans, training, and risk registers.

    Consider an A320 assembly line with repeated torque-out defects on titanium fasteners. The first NCR leads to MRB rework. The second NCR leads to another rework decision. By the third similar event from the same supplier, the pattern points beyond one lot. CAPA becomes necessary because the production process or supplier control process may be unstable.

    A thorough investigation might find improper furnace calibration at the supplier. Corrective and preventive actions could include supplier calibration controls, revised incoming inspection checks, updated work instructions, and tighter supplier scorecards. Connect981 can visualize this chain across programs and suppliers, giving quality and supply chain management one view of NCRs, MRB outcomes, and CAPA status.

    Technicians are gathered around an inspection bench, meticulously reviewing aircraft fasteners and precision tools as part of the quality control process in aerospace manufacturing. This collaborative effort highlights important quality system elements and the commitment to continuous improvement and risk management.

    4. Decision Boundaries: When You Stop at NCR/MRB and When You Escalate to CAPA

    A major source of confusion in ncr vs mrb vs capa is the assumption that every NCR must become CAPA. That is not a robust process. It creates backlog, weak problem solving, and shallow corrective actions.

    You may stop at NCR plus MRB when the cause is obvious, risk is low, impact is local, and recurrence is unlikely. A single handling scratch on a nacelle panel may require containment, repair, documentation, and perhaps localized training. It does not automatically justify a full CAPA.

    Escalate to CAPA when root cause is unclear, recurrence is likely, potential risks extend across other products or suppliers, or the issue affects safety, compliance, delivery, or customer satisfaction. Frequent low-severity NCRs can justify CAPA if they reveal process problems or create cost and schedule impact.

    Effective NCR processes require clear definitions of escalation criteria to ensure consistent decision-making across an organization. NCRs should be used to capture not only isolated incidents but also to identify systemic issues that may require corrective actions to prevent recurrence.

    Good boundaries use risk matrices, FMEA scores, program-specific criteria, and documented risk tolerance set by OEMs or airworthiness authorities. This makes sense in multi-site networks where tribal judgment creates variation. Connect981 helps standardize these thresholds while still allowing site-specific controls.

    5. What Not to Conflate: Common Misunderstandings About NCR, MRB, and CAPA

    Many audit findings and quality escapes happen because organizations collapse these distinct concepts into one informal process. The result is incomplete records, weak root cause determination, and poor closure evidence.

    Common errors include:

    • MRB disposition is not corrective action. Rework or scrap fixes the lot, not necessarily the process.
    • NCR closure is not CAPA closure. “Fixed this part” is not the same as “fixed the cause.”
    • CAPA closure is not complete until effectiveness is verified with objective evidence.
    • Preventive actions are not MRB dispositions. They are changes to process, training, design controls, supplier controls, inspection plans, or environmental conditions.

    The separation is simple. NCR documents and controls the event. MRB documents risk based product disposition. CAPA documents system-level corrective and preventive actions and verifies they were properly addressed.

    Under-escalation is dangerous when repeated NCRs are closed through MRB without recognizing a trend. Over-escalation is also a problem because opening CAPA for every routine defect creates fatigue and delays serious investigations.

    For aerospace manufacturing, AS9100 expects control of nonconforming outputs and effective corrective action. For medical devices, FDA 483 observations and warning letters often cite weak capa procedures, poor complaint handling, and failure to verify effectiveness. A well-designed digital workflow separates the steps while keeping traceability between them.

    6. Risk Management Across NCR → MRB → CAPA

    Risk management in quality assurance involves identifying, assessing, and mitigating potential threats to processes to ensure product safety and reliability. A robust risk management process is essential for maintaining compliance with regulatory standards, as it helps organizations proactively address potential quality issues before they escalate.

    Incorporating risk management into the CAPA process is crucial, as it ensures that corrective and preventive actions are aligned with the severity and likelihood of potential risks.

    At each stage, risk changes shape:

    • NCR stage: screen whether the nonconforming product could have escaped, affected airworthiness, violated customer requirements, or created downstream quality problems.
    • MRB stage: determine whether use-as-is, repair, rework, or scrap is justified. Use-as-is should only occur when risk analysis confirms no safety or performance impact.
    • CAPA stage: determine whether the failure mode can affect the entire organization, other lines, other suppliers, or other programs.

    Risk tools may include FMEA, hazard analysis, severity and occurrence scoring, and program-specific control plans. In medical devices, CAPA actions may also update ISO 14971 risk management files. In Connect981, centralized risk data across NCRs, MRB records, and CAPA cases supports predictive analytics and better prioritization.

    7. How NCR, MRB, and CAPA Interact with Supply Chain Management

    Supplier issues are a major source of NCR volume in aerospace. Effective supplier management involves qualifying, evaluating, and monitoring the performance of suppliers to ensure compliance with industry standards and specifications.

    Establishing stringent criteria for supplier selection and ongoing evaluation is crucial for maintaining quality and compliance in aerospace manufacturing. A robust supplier management process includes issuing nonconformance reports (NCRs) when items purchased from suppliers do not meet established specifications, which can lead to corrective actions if issues are systemic.

    A typical supplier workflow starts with an NCR for composite plies out of tolerance, incorrect material certs, or a machined feature outside drawing limits. MRB then decides whether to rework internally, return to supplier, scrap, or expedite replacement. If the same supplier or commodity repeats the issue, CAPA or supplier corrective action becomes appropriate.

    Supplier corrective action requests (SCARs) may be necessary when suppliers repeatedly fail to provide items that meet specifications, indicating a need for more serious intervention. Supplier PPM, on-time delivery, MRB scrap rates, and customer feedback should all feed capa sources.

    Connect981 supports supplier collaboration by sharing controlled NCR, MRB, and CAPA-related information without relying on disconnected spreadsheets or email threads.

    The image depicts a supplier receiving area filled with inspected aerospace parts stored in clearly labeled containers, highlighting the importance of the quality control process and supply chain management in aerospace manufacturing. This organized setup reflects a robust process for managing quality issues and ensuring compliance with customer requirements.

    8. Industry Examples: Aerospace Manufacturing, MRO, and Medical Devices

    The workflow logic is consistent across regulated industries, but the triggers differ.

    In aerospace manufacturing, repeated paint thickness nonconformities on control surfaces for a 2025 production program may start as final inspection NCRs. MRB may allow rework for affected surfaces. If the pattern continues, CAPA adjusts paint process parameters, operator training, spray booth controls, and inspection frequency.

    In aerospace MRO, multiple repair stations may report the same nonconforming repair outcome on an engine component. Local MRB teams disposition the affected hardware, but the trend should roll into a network-level CAPA. The improvement may include revised repair instructions, validation checks, tooling controls, and technician qualification updates.

    In medical devices, nonconforming product, complaint trends, returns, and customer complaints are common CAPA sources under ISO 13485 and FDA expectations. The same distinction applies: NCR identifies problems, MRB-like review controls product, and CAPA addresses the system.

    In all cases, the value comes from relationship clarity. NCRs detect. MRB controls. CAPA transforms the system so organizations can deliver high quality products with better compliance readiness.

    9. Digitalizing the NCR–MRB–CAPA Chain with Connect981

    Brownfield aerospace environments often spread NCR, MRB, and CAPA work across ERP, MES, legacy QMS, file shares, spreadsheets, paper travelers, and email. That fragmentation creates missed escalations, incomplete thorough documentation, delayed approvals, and weak audit trails.

    Connect981 acts as a unified aerospace operations platform. It ingests NCR data from shopfloor execution, inspection, supplier portals, and existing enterprise systems. It routes MRB decisions through configurable zero-code workflows with the right engineering, quality, manufacturing, and supply chain approvals. It links CAPA records to the originating NCRs, MRB decisions, serial numbers, work orders, and production data.

    The practical capabilities are direct:

    • Digital work instructions update when CAPA actions change the process.
    • Parts traceability and serial number control enforce MRB decisions at point of use.
    • Dashboards show NCR trends, MRB scrap versus rework ratios, CAPA aging, supplier performance, and iso audit readiness.
    • AI-assisted root cause analysis helps identify problems earlier and suggests likely contributing factors for review.
    • Automated alerts help teams address problems before overdue tasks become compliance exposure.

    Technology does not replace quality judgment. It gives the quality system a more reliable operating structure. For teams comparing ncr vs mrb vs capa, the goal is not more terminology. The goal is one connected workflow where product and quality problems are visible, decisions are documented, and improvement is measurable.

    To see an end-to-end digital NCR → MRB → CAPA workflow in action, request a demo of Connect981.

  • ISO 22400 Inventory Accuracy: Practical KPIs for Aerospace Work-Order Control

    ISO 22400 Inventory Accuracy: Practical KPIs for Aerospace Work-Order Control

    Introduction: Why ISO 22400 Matters for Inventory Accuracy in Aerospace

    In aerospace, inventory accuracy is not an accounting preference. It determines whether a work package can start, whether a technician can complete a task without interruption, and whether the record behind a serialized part will stand up during an audit. A missing bushing, an expired consumable, or a wrong-revision component can stop a narrow-body heavy check as surely as a major structural finding.

    ISO 22400 gives operations teams a common way to define key performance indicators across manufacturing systems. This article focuses on one practical application: iso 22400 inventory accuracy for aerospace manufacturing and MRO work-order control. The goal is not to explain the standard in abstract terms. The goal is to identify the inventory metrics that improve decisions on the floor.

    For aerospace manufacturing and maintenance operations, inaccurate stock data creates consequences beyond higher operating costs. It can trigger AOG spares escalation, missed turnaround commitments, repeated re-kitting, poor order accuracy, and audit exposure tied to traceability or revision control. Stock-outs, or instances when demand cannot be met due to insufficient inventory, can lead to lost sales and customer dissatisfaction, highlighting the importance of effective stock level management.

    Connect981 approaches this from the operating layer. The platform connects ERP, MES, WMS, supplier data, digital work instructions, and shopfloor execution events so inventory management kpis can be calculated from live work, not manually rebuilt in spreadsheets after the fact.

    A technician is carefully inspecting aircraft components in a clean aerospace maintenance hangar, ensuring quality operations and adherence to key performance indicators for inventory management. The organized space reflects efficient manufacturing operations management, highlighting the importance of inventory accuracy and demand forecasting in maintaining high standards of customer satisfaction.

    ISO 22400 Basics: From Standard to Day-to-Day Inventory Metrics

    ISO 22400 is an international standard that defines a standardized framework for Key Performance Indicators (KPIs) used in Manufacturing Operations Management (MOM). It was developed by the International Organization for Standardization, the international organization behind many global operating standards, and ISO 22400-2:2014 provides a catalogue of KPI definitions for manufacturing operations management.

    The standard mandates that every metric follow a rigid structural template to eliminate arbitrary definitions across different production sites. ISO 22400 provides precise formulas and data elements for critical KPIs to ensure consistency across different software systems, production sites, and industries. In practice, that means an inventory kpi calculated at one plant should mean the same thing at another plant if both use the same objects, time model, and data definitions.

    ISO 22400 maps directly to the hierarchical models found in IEC 62264, linking inventory metric calculations with physical shop floor nodes. That matters when a KPI must be calculated for a plant, line, work center, cell, storage location, or specific work unit. ISO 22400 categorizes KPIs into specific groups to support lean manufacturing and waste reduction, and ISO 22400 emphasizes that inventory should be evaluated using standardized time models to understand inventory transit and storage delays. More detail on the standard is available through the ISO 22400-2 catalogue.

    For inventory management, the useful point is simple: key performance indicators kpis should connect stock, time, orders, quality, and production performance. Key performance indicators (KPIs) in inventory management are metrics that help monitor and make decisions about stock, providing insights into turnover, sales, demand, costs, and process success.

    ISO 22400 defines several specific KPIs relating to inventory operations, such as Inventory Turns and Storage Loss Ratio, to prevent production bottlenecks. These map naturally to familiar inventory metrics such as inventory turnover, inventory days, inventory to sales ratio, stock to sales ratio, lead time, and order cycle performance.

    In aerospace operations management, those metrics need careful scope. A part may be physically present but unusable because it is on quality hold, at the wrong revision, missing paperwork, under repair, or assigned to another aircraft. Inventory management systems, manufacturing execution systems, automation systems, ERP, WMS, QMS, and supplier portals must agree on that status, or the KPI shows confidence that the shopfloor cannot use.

    Core ISO 22400-Aligned KPIs That Directly Improve Inventory Accuracy

    The first question is which ISO 22400-aligned KPIs actually matter for inventory accuracy. In aerospace factories and MRO shops, the answer is not every dashboard number. The useful metrics are the ones that expose whether available inventory is real, usable, traceable, and aligned with upcoming work.

    Inventory Accuracy. This kpi measures whether the physical stock matches the electronic records. Inventory accuracy is crucial for ensuring that the physical stock matches the electronic records, which helps prevent issues such as poor order accuracy and increased costs. Available inventory accuracy can be calculated using the formula: Available inventory accuracy = (# counted items that match record / # counted items) x 100, which helps identify discrepancies between recorded and actual stock levels.

    Track this at material group level for flight-critical, safety-critical, consumables, and controlled hardware. Track it at work-center level for line-side bins, tool cribs, quarantine areas, and kitting zones. In supply chain management, maintaining high Inventory Record Accuracy (IRA), typically aiming for 95% to 99%, is crucial. For critical serialized parts, many aerospace teams target the upper end of that range because one wrong serial number can invalidate a work package.

    Maintaining high inventory accuracy is essential for effective inventory management, as it directly impacts the ability to fulfill customer orders and manage stock levels efficiently. In an MRO facility, this includes parts removed from an aircraft, parts under evaluation, parts awaiting disposition, and parts returned to stores after work stops.

    Inventory Shrinkage. Inventory shrinkage measures the gap between book stock and physical stock after normal transactions are accounted for. The basic calculation is book quantity minus physical quantity, divided by book quantity. Aerospace causes include scrapped serialized parts not closed correctly, cannibalization not logged, parts moved between bays without scans, kits opened early, or returns placed in the wrong controlled location.

    ISO 22400 supports this through its loss categories, including storage and transport loss. A storage loss ratio can be calculated as storage and transportation loss divided by consumed material. Track shrinkage by location, material class, and work center. A plant-level total inventory view is useful for business planning, but it will not show whether the receiving dock, internal transport route, or final kitting area is the source of loss.

    Inventory Turnover Rate. The inventory turnover rate measures how many times a company sells and replaces its stock in a given period, typically a year, indicating how well a company manages its inventory. The inventory turnover rate measures how many times a company sells and replaces its stock in a period, indicating how well a company makes sales from its inventory. In aerospace, this can be adapted to how many times inventory is consumed, repaired, issued, or replaced against work-order throughput.

    The formula for calculating inventory turnover is: Inventory turnover rate = Cost of goods sold / Average inventory, which helps businesses assess their inventory efficiency. ISO 22400 expresses inventory turns as throughput divided by average inventory. To calculate average inventory, use beginning inventory plus ending inventory divided by two for the specific period being reviewed. For value-based reporting, teams often use average inventory value rather than unit count.

    A higher inventory turnover rate generally indicates efficient inventory management, as it suggests that a company is selling its products quickly and not overstocking. In aerospace, the interpretation must be segmented. Fast-moving consumables should turn quickly. Rotables, life-limited parts, and strategic AOG spares may turn slowly by design. The inventory turnover rate is useful only when tied to customer demand, actual demand, program risk, and service commitments.

    Inventory to Sales Ratio and Stock-to-Sales. The stock-to-sales ratio is a key metric that compares the amount of inventory available for sale to the amount sold, helping businesses optimize their stock levels and improve cash flow. In aerospace manufacturing and MRO, the sales ratio usually maps to throughput, completed work packages, maintenance events, or shipped assemblies rather than retail sales. The inventory to sales ratio can be calculated as inventory value divided by throughput value for the same period.

    Maintaining a balanced stock-to-sales ratio is crucial; a low ratio may indicate a risk of stockouts, while a high ratio can lead to increased holding costs. Tracking stock levels is crucial for maintaining a balance between supply and demand, as having too much inventory can lead to increased costs, while too little can result in missed sales opportunities. This is where excess inventory, unsold inventory, dead stock, and remaining inventory become operational risks, not just finance terms.

    Track this at program level, spares warehouse level, and material group level. A high total inventory value can look safe while the floor still suffers stock outs on small but line-critical hardware. A low stock to sales ratio may improve cash flow until a high-priority aircraft cannot be released.

    Inventory Days and Days Sales of Inventory. Days sales of inventory (DSI) is a related metric that indicates the average number of days it takes to sell through inventory, with lower values indicating faster turnover. Days on hand (DOH) is a KPI that indicates the average number of days inventory is held before it is sold, helping businesses understand how long cash is tied up in stock. In aerospace, inventory days should be calculated by material class and operational use.

    For titanium forgings, composite materials, shelf-life adhesives, sealants, fasteners, and life-limited parts, inventory days highlights exposure to aging, expiration, storage errors, and configuration changes. It also helps identify materials that cannot be sold, consumed, installed, or released because documentation is incomplete. When days sales, inventory days, and demand forecasting accuracy diverge, planners should review stock purchases, reorder logic, and expected work-order load.

    Carrying Cost. Carrying cost measures the full cost of holding stock. Inventory carrying cost includes capital costs, storage space costs, insurance, inventory service costs, handling, compliance storage, climate control, obsolescence, shrinkage, and inventory risk costs. For aerospace, holding costs also include shelf-life monitoring, temperature-controlled storage, security, serialization, and the labor needed to maintain accurate documentation.

    Calculate carrying cost by class, not just across total inventory. Flight-critical rotables, AOG spares, expendables, and consumables have different risk profiles. A gross margin return view may help finance understand whether inventory value supports output, but operations needs the practical version: which stock is protecting schedule, which stock is hiding poor data, and which stock is tying up cash flow without supporting work.

    The image depicts an organized aerospace parts storage area featuring labeled bins and sealed components, emphasizing effective inventory management and high inventory accuracy. This setup aids in optimizing supply chain operations and maintaining customer satisfaction through efficient storage and retrieval processes.

    Work-Order Control KPIs: Using ISO 22400 to Keep Orders and Inventory in Sync

    Inventory accuracy is only useful if it stays synchronized with work-order execution. A warehouse record can be correct at 7 a.m. and operationally wrong by 10 a.m. if a kit is short, a serial is substituted without approval, or a return is not posted after a job is paused.

    Order Cycle Time / Manufacturing Order Lead Time. This kpi measures elapsed time from work-order release to completion. ISO 22400 provides time elements such as planned and actual order execution time, which support consistent lead time tracking. Teams can calculate lead time as completion timestamp minus release timestamp, then separate waiting time, queue time, inspection time, and rework time.

    Long lead time often reveals inventory problems that are not visible in stock records. An order may sit because a serialized component is in inspection, a kit is physically staged in the wrong bay, or a supplier certificate is missing. In production scheduling, lead time should be reviewed beside material availability, not as a standalone labor metric.

    Schedule Adherence. Schedule adherence measures the percentage of work-orders started or finished as planned. ISO 22400 event data supports this through planned and actual timestamps for order release, start, stop, and completion. When schedule misses repeat in the same cell, the cause may be phantom stock, low pick accuracy, late inspection release, or wrong configuration in the kit.

    A structural repair can show this clearly. The schedule says reassembly starts Thursday morning. The ERP record says the bracket is available. At issue, the part is found at the prior revision. The schedule adherence miss is not simply a production delay. It is an inventory, configuration, and documentation failure.

    Material Availability at Order Release. This measures the percentage of work-orders that launch with all required components available, reserved, traceable, and ready for use. The formula is work-orders released complete divided by total work-orders released. This KPI uses BOM, routing, inventory, reservation, quality hold, and material issue events.

    High stock-out rates can lead to customer dissatisfaction, as they indicate that demand cannot be met due to insufficient inventory, resulting in lost sales and frustrated customers. In aerospace, stock outs may also trigger AOG escalation, overtime, schedule compression, or customer relations issues with an airline or prime contractor.

    Pick, Pack, and Kitting Accuracy. This measures whether the correct components, quantities, serials, lots, and revisions are issued to the work-order. It is one of the most important operational controls for aerospace because the wrong part can be worse than no part. A wrong-revision bushing or unapproved substitution may create rework, nonconformance, or compliance exposure.

    This KPI relies on material issue events, barcode or RFID scans, work-order requirements, and revision-controlled documents. It catches hidden inventory issues such as mislocated bins, duplicate labels, mixed lots, uncontrolled substitutions, and delayed returns to stock.

    Perfect Work Order. A perfect work order is the internal equivalent of a perfect order rate. It is complete, on time, correctly kitted, correctly documented, and free of avoidable material or quality issues. Customer satisfaction is significantly influenced by the perfect order rate, which measures the percentage of orders delivered without issues such as damage, inaccuracies, or delays, with a target of 100%.

    The Net Promoter Score (NPS) is a key metric for assessing customer experience, indicating how a business is perceived by its customers and highlighting the importance of fulfilling orders to maintain satisfaction. Aerospace programs may not use retail language, but the principle is the same. A company ships assemblies, aircraft sections, repaired components, or maintenance releases with the expectation that the order is correct the first time. Excellent customer satisfaction depends on that reliability.

    In a C-check, a late non-destructive inspection kit can delay reassembly even if every labor step is staffed. If the kit completeness KPI shows the NDI kit is incomplete before the work-order starts, the supervisor can expedite, reschedule, or split work intelligently. Without that signal, technicians discover the shortage mid-task, and the delay becomes harder to recover.

    Vanity Metrics vs. Operational KPIs: What Aerospace Teams Should Stop Tracking

    Vanity metrics are numbers that look useful on a dashboard but do not change decisions, production processes, or work-order performance. In inventory management, they create false confidence because they summarize activity without showing correctness, availability, or impact.

    Common examples include:

    • Overall SKU count changes without segmentation. A smaller SKU list does not prove better inventory management if critical fasteners still create line stoppages.
    • Total purchase order lines per month. PO volume says little about whether stock purchases matched actual demand or whether suppliers delivered usable parts.
    • Generic “items moved” volume. Movement is not performance if the wrong items are moved or if material is moved without accurate documentation.
    • A high-level service level that ignores partial fills, substitutions, wrong revisions, or quality holds. Teams should calculate service level only with clear rules for complete, usable, compliant fulfillment.
    • Average stock value across all categories. This hides whether average inventory is tied up in excess inventory, slow rotables, or dead stock that cannot support current work.

    Replace raw movement counts with pick accuracy and material availability at order release. Replace gross stock value with carrying cost by class, inventory days by class, and stockout exposure for critical parts. Replace generic service level with perfect work order, backorder rate, and schedule adherence.

    The backorder rate measures the number of orders a company cannot fulfill when a customer places an order, indicating how well a company stocks in-demand products. In aerospace, the “customer” may be an airline, final assembly line, engine shop, or next internal work center. If the backorder rate is high, the operation is telling the next process that demand cannot be met.

    A vanity metric can hide the real problem: technicians hunting for parts during a heavy check, frequent re-kitting for the same work package, or repeated shortages of low-cost hardware that stops high-value work. The better KPI is the one that forces a decision.

    How to Select the Right ISO 22400 Inventory KPIs for Your Operation

    KPI selection should begin with the operational problem, not the dashboard template. Start with recurring AOG events, overtime on weekend shifts, late work-orders, poor kit quality, concessions, rework, or customer complaints. Then select ISO 22400-aligned performance indicators that expose the process failure behind the symptom.

    Step 1: Map critical value streams. Separate engine overhaul, landing gear repair, composite structures, final assembly, spares distribution, and maintenance operations. Each flow has different routing, supplier dependency, quality operations, and inventory risk. A landing gear shop may care about rotables and repair history. A composite line may care about shelf-life, freezer control, and inventory days.

    Step 2: Identify where inventory errors show up. Look for delays, scramble buys, substitutions, nonconformances, repeated part searches, high adjustment counts, and late supplier paperwork. This is where data collection should be practical. If a technician must write a note in a spreadsheet after the event, the signal will be late and inconsistent.

    Step 3: Choose three to five core KPIs per value stream. A strong set often includes inventory accuracy, material availability at release, pick accuracy, order lead time, and stockout rate for critical items. Add inventory turnover rate or carrying cost where cash flow and stock levels are the main constraint. Add demand forecasting accuracy where planners are repeatedly buying too much of the wrong material or too little of the right material.

    Step 4: Define targets and cadence. Review cell-level KPIs weekly and site-level KPIs monthly. Use realistic thresholds. Inventory Record Accuracy around 95% to 99% is a common operating range, with higher expectations for serialized and flight-critical material. The target should support strategic goals such as turnaround time, on-time delivery, audit readiness, and customer satisfaction.

    Step 5: Tie every miss to a corrective workflow. A low inventory accuracy result should trigger root cause analysis: receiving error, delayed scan, wrong bin, incorrect BOM, supplier label mismatch, unposted scrap, or uncontrolled move. If the metric only produces a report, it will not change business processes.

    For a new narrow-body line in 2026, the starter KPI set might include line-side inventory accuracy, material availability at work-order release, inventory days for composite materials, perfect work order rate, and carrying cost for high-value rotables. For an MRO facility, the right move may be reducing 20 or more metrics down to six: schedule adherence, pick accuracy, material availability, life-limit compliance, inventory accuracy, and carrying cost.

    Using ISO 22400 Inventory KPIs in Daily Aerospace Operations

    ISO 22400-based inventory metrics become valuable when they are part of daily operations management. They should appear in shift standups, tiered meetings, shortage reviews, quality reviews, and continuous improvement cycles. The screen should show what a supervisor can act on today, not only what happened last month.

    In practice, that means real-time dashboards showing inventory accuracy by area, inventory days by material class, open work-orders with material readiness badges, and alerts where the inventory-to-sales ratio or stock to sales ratio crosses thresholds. A work-order scheduled for release should be flagged automatically if material availability is below target.

    Connect981 can pull events from ERP, MES, WMS, and shopfloor workflows: order releases, material issues, receipts, returns, adjustments, quality holds, scrap, and supplier status updates. The platform then calculates ISO 22400-aligned inventory metrics without forcing planners to rebuild numbers manually. This improves trust because the KPI is tied to the same events technicians and supervisors use to execute work.

    A technician preparing for a job can see a kit completeness status before opening the task. If a controlled fastener is short, the issue is visible before the technician starts the removal step. The work can be resequenced before a mid-task stockout creates lost time.

    A supply chain manager can compare sell-through rate, inventory days, and inventory turnover for fast-moving consumables versus slow-moving rotables. The sell-through rate compares the amount of inventory sold to the amount received from a manufacturer, demonstrating the efficiency of a supply chain. In aerospace, this helps planners decide where to rebalance stocking policies, use vendor consignment, or pool spares across sites.

    A plant manager can use shrinkage and available inventory accuracy to justify process changes in receiving and put-away. If the metric shows repeated errors between receiving inspection and stores, the corrective action may be double scanning, improved labeling, bin redesign, supplier label rules, or tighter quarantine controls.

    An aerospace production team is gathered near an aircraft assembly, reviewing tablet-based work instructions to ensure accuracy in their manufacturing operations management. The scene highlights the importance of inventory management and key performance indicators as they work to optimize production processes and maintain high customer satisfaction.

    Key ISO 22400-Style Inventory KPIs: Quick Reference

    Use this at-a-glance list to select inventory management kpis that support inventory accuracy, work-order control, and customer satisfaction.

    • Inventory Accuracy. Confirms that system records match physical stock. Most useful in line-side storage, tool cribs, MRO stores, and serialized parts cages; primarily supports inventory accuracy.
    • Inventory Shrinkage. Shows losses from damage, misplacement, unposted consumption, scrap, or uncontrolled movement. Most useful in receiving, internal transport, and kitting areas; supports inventory accuracy and cost control.
    • Inventory Days / DSI. Shows how long stock is held before use, sale, installation, or release. Most useful for shelf-life materials, life-limited parts, and expensive long-lead items; supports planning and cash flow.
    • Inventory-to-Sales Ratio / Stock-to-Sales. Compares inventory value or units against throughput, work completed, or sales. Most useful at program, spares warehouse, and MRO shop level; supports stock levels, working capital, and schedule protection.
    • Carrying Cost. Measures capital, storage, insurance, compliance, service, handling, obsolescence, and risk costs. Most useful for senior operations, supply chain management, and finance reviews; supports cost control and stocking policy.
    • Sell-Through Rate. Shows whether consumables and expendables are being used or sold at the pace expected. Most useful in spares warehouses and consumable stores; supports inventory management and demand planning.
    • Backorder or Stockout Rate. Measures demand that cannot be fulfilled when needed. Most useful for critical parts, AOG spares, and production constraints; supports customer satisfaction and schedule reliability.
    • Material Availability at Work-Order Release. Confirms that required parts, documents, serials, and revisions are ready before work starts. Most useful in production scheduling, MRO planning, and kitting; supports work-order control.
    • Perfect Work Order / OTIF for Internal Orders. Measures whether a work-order is on time, complete, correctly documented, and correctly supplied. Most useful for program reviews and customer-facing operations; supports excellent customer satisfaction.
    • Order Cycle Time / Lead Time. Measures release-to-completion time and exposes waiting caused by material, quality, or supplier issues. Most useful in factory lines, repair shops, and maintenance operations; supports work-order flow and customer commitments.

    These kpi measures should be defined by object, location, time horizon, and ownership. That is how inventory metrics become usable across manufacturing systems instead of becoming another reporting burden.

    How Connect981 Implements ISO 22400 Inventory KPIs in Aerospace

    Connect981 is a unified aerospace operations platform that sits above ERP, MES, QMS, supplier systems, and shopfloor workflows. It does not require teams to replace every core system. It creates a connected operating layer where work-orders, material events, quality checks, documentation, and supplier collaboration share the same execution context.

    For ISO 22400-aligned inventory accuracy, Connect981 ties digital work instructions to specific part numbers, serial numbers, lots, revisions, and configuration requirements. Material issue, return, inspection hold, scrap, and adjustment events are logged against the work-order. That makes inventory accuracy, inventory days, sell-through rate, stockout rate, carrying cost inputs, and work-order readiness visible from live data.

    The platform also supports cross-factory and cross-supplier visibility. That helps reduce phantom stock, missed handoffs, and supplier status surprises. AI-assisted root cause analysis can connect a low inventory accuracy result in one cell to the process step causing the problem, such as receiving, put-away, kitting, return-to-stock, or documentation release.

    Role-based dashboards give plant managers, supply chain directors, quality leaders, and program managers the view they need. A plant manager may focus on schedule adherence and shrinkage. A supply chain director may focus on inventory turnover, stock outs, and supplier readiness. A quality leader may focus on traceability, revision control, and accurate documentation.

    To see ISO 22400-style KPIs running on real aerospace workflows, request a demo of Connect981.

    Conclusion: Making ISO 22400 Inventory KPIs Work for Your Operation

    ISO 22400 is most useful when it becomes a practical toolkit for inventory accuracy and work-order control. The value is not in having more metrics. The value is in having a small set of clearly defined KPIs that show whether stock is real, usable, traceable, and available when the work-order needs it.

    Aerospace teams should audit their current KPI set and remove numbers that do not change decisions. Prioritize inventory accuracy, material availability at release, pick accuracy, stockout exposure, lead time, inventory days, and carrying cost where they directly support customer satisfaction and production performance.

    The next quarter is enough time to improve two or three measures if the data is connected to the workflow. Platforms like Connect981 help automate data collection, reduce spreadsheet dependence, and keep KPI definitions consistent across sites, suppliers, and programs as production rates increase in 2026 and beyond.

  • Work Order Visibility: The KPIs That Tell You If Your Production Is Under Control

    Work Order Visibility: The KPIs That Tell You If Your Production Is Under Control

    Most aerospace factories do not fail because leaders lack reports. They fail because the report arrives after the work order has already missed its internal handoff, sat in inspection for three days, or consumed capacity that was needed for a higher priority program.

    Work order visibility means having real-time, centralized access to the status, details, and progress of service requests or tasks across an organization. In aerospace manufacturing and MRO, that means knowing where every build package, repair order, inspection step, supplier operation, and sign-off stands from release to shipment.

    This page focuses on the manufacturing kpis that show whether work orders, WIP, bottlenecks, and execution discipline are actually under control. It also calls out dashboard metrics that look clean in a review meeting but hide late work, production downtime, rework loops, and unstable production performance.

    Connect981 gives aerospace and MRO teams a unified operations layer that connects ERP, MES, QMS, supplier inputs, documentation, and shopfloor execution into one live view. Centralizing data eliminates paper logs and disjointed spreadsheets.

    Core themes:

    • work order visibility across plants, suppliers, and internal routing
    • WIP flow, WIP age, bottleneck queues, and stranded orders
    • schedule adherence, on time delivery risk, and promised versus actual dates
    • execution discipline across production, quality control, maintenance, and changeovers

    An aerospace technician is reviewing a tablet while standing next to a partially assembled aircraft structure, focusing on key performance indicators related to the manufacturing process. The scene highlights the importance of production efficiency and quality control in the manufacturing industry.

    What “Work Order Visibility” Really Means on the Shop Floor

    Work order visibility is execution-layer visibility. It is not a monthly finance report, a static export from ERP, or a spreadsheet maintained by one planner. It is the live state of every work order, including where it is in the routing, what operation is active, what it is waiting on, how long it has been waiting, and who owns the next action.

    Manufacturing KPIs are quantifiable measurements that evaluate production processes against specific business objectives, helping manufacturers track performance and identify inefficiencies. The issue is that many manufacturing companies track high level manufacturing metrics without tying them to the work order status that explains what is happening now.

    A useful visibility model answers these questions:

    • Where is each work order in the route, by operation, work center, supplier, or production line?
    • What is active now, and what was planned to start or finish today?
    • Is the work order on schedule against promised internal dates?
    • What is blocking it, such as raw materials, NCR disposition, capacity, maintenance, calibration, or missing documentation?
    • What are the production costs, labor hours, maintenance cost, and cost per unit impact of delay or rework?
    • How does the delay affect customer demand, lead time, and on time delivery?

    Consider a 2026 narrow body wing assembly work order. Op 30 is sealant cure, with a 48 hour cure and post-cure inspection. Op 60 is NDT inspection. If primer is missing, an inspector is unavailable, or the NDT cell is overloaded, work order visibility must show the order in a precise waiting state. “In process” is not enough.

    Visible but unmanaged means leaders can see WIP piling up but no one owns the action. Visible and under control means every exception has an owner, timestamp, reason code, escalation path, and recovery plan.

    Standardizing workflows defines clear statuses like ‘Requested,’ ‘Approved,’ ‘In Progress,’ and ‘Complete.’ To improve work order visibility, organizations should implement standardized digital tracking templates and utilize real-time automated status updates.

    Core Work Order Visibility KPIs: How to Tell If Orders Are Under Control

    Operations leaders should group key performance indicators around flow, schedule adherence, and stability. Chasing 50 manufacturing metrics creates noise. The essential manufacturing kpis for work order visibility are fewer, more operational, and tied directly to live status.

    Key performance indicators (KPIs) in manufacturing help assess productivity, quality, customer satisfaction, and profit, providing insights that can drive operational improvements. Manufacturing KPIs should be aligned with business goals to effectively measure, analyze, and track performance, encouraging improvements in process speed and quality.

    Use these essential manufacturing kpis as the core of a manufacturing kpi dashboard:

    These are manufacturing key performance indicators for execution, not just accounting. Finance still needs total manufacturing costs, revenue manufacturing cost ratios, manufacturing cost, manufacturing cost per unit, unit manufacturing cost, and cash flow views. Operations needs current signals that show what will miss before it misses.

    Work Order Cycle Time & Lead Time

    Work Order Cycle Time is the release to completion duration for a discrete work order. It is narrower than total customer lead time, which includes order processing, procurement, production, and delivery.

    Cycle time is a critical metric for production efficiency, representing the total time taken to complete a manufacturing process from start to finish, and is essential for identifying bottlenecks in production. Lead time is the total time it takes for customers to receive orders after they are placed, encompassing order processing, production, and delivery times, which is critical for optimizing supply chain performance.

    For 2026 aerospace subassemblies, complex routes with special processes may target a median cycle time of 7 to 10 days, with a 90th percentile near 15 days. Simpler parts may be expected in 1 to 3 days. The average time matters, but variation often matters more. A stable 8 day production cycle is easier to manage than a nominal 6 day cycle with frequent 20 day outliers.

    Connect981 surfaces current versus historical cycle time by routing, product family, supplier, and customer program. In daily tier meetings, leaders should use cycle time to ask:

    • Which orders are older than the route standard?
    • Which work centers create the widest 90th percentile spread?
    • Which NCRs, material shortages, or approvals are extending the production process?
    • What process improvement or continuous improvement initiatives are reducing variation?

    Optimizing lead time, which measures the total time from receiving a customer order to delivering the product, is critical for improving manufacturing efficiency and customer satisfaction. The cash-to-cash cycle time, which measures the time between purchasing raw materials and receiving cash from product sales, is a key metric for assessing operational efficiency in manufacturing.

    Schedule Adherence and Promised vs. Actual Start/Finish

    Schedule adherence is the percentage of operations or work orders started and completed on their planned dates. It is not the same as monthly units produced or total volume shipped.

    A plant can hit actual production output against target production output and still have poor schedule adherence. The result is familiar: overtime, expediting, unstable WIP, missed internal handoffs, and planner firefighting. Production attainment compares what was actually completed with what was planned, but schedule adherence shows whether the right work moved at the right time.

    A practical schedule dashboard should show:

    • orders planned for today but not started
    • operations due today but still in setup or waiting
    • operations late to finish by cell, line, supplier, or program
    • early starts that consume capacity needed elsewhere
    • production capacity consumed by rework, inspection holds, or changeovers

    For example, during the week of 14 to 20 September 2026, Connect981 can show per-cell and per-supplier schedule adherence with color-coded exceptions. A supervisor sees today’s work. A plant manager sees constraint risk. A program manager sees milestone impact.

    Automated alerts and accurate ETAs keep clients informed, fostering trust and transparency. On-time delivery measures the percentage of products delivered on time to customers compared to the total volume of delivered products, serving as a key indicator of supply chain efficiency and customer satisfaction.

    WIP Visibility: WIP Count, WIP Age, and Bottleneck Queues

    WIP Count is the number of active work orders or units between release and completion. WIP Value is the financial value tied up in those orders. WIP Age is how long each order has been open, or how long it has remained in a current operation or waiting status.

    Total WIP value alone is weak. WIP Age by work center is stronger because it shows where work is actually stuck. In high mix, low volume aerospace environments, 1 to 3 days of queue at the constraint may be acceptable. Orders older than 10 days should be rare and visible to leadership.

    A simple WIP age view should group orders into:

    • 0 to 2 days
    • 3 to 5 days
    • 6 to 10 days
    • more than 10 days

    If 30 percent of WIP is older than 10 days, a healthy looking output chart is not enough. That WIP is already predicting missed on time delivery.

    Inventory turnover measures how quickly inventory is sold or consumed over a specific period, indicating the efficiency of inventory management and its impact on cash flow within the supply chain. Average inventory and average inventory value also matter, but they should not replace WIP age, queue time, and operation status.

    Expense tracking allows instant monitoring of parts, labor hours, and miscellaneous costs. When Connect981 ties expense tracking to live work order status, leaders can see whether production costs are being driven by rework, waiting, expedited materials, or poor flow.

    The image depicts aircraft component racks organized in a clean manufacturing area, where operators are utilizing tablets to monitor key performance indicators and enhance production efficiency. This setting highlights the importance of effective manufacturing processes and quality control in the manufacturing industry.

    Throughput, Capacity Utilization, and Asset Utilization at the Constraint

    Visibility-focused dashboards should anchor throughput at the constraint, not plant-wide averages. In aerospace, the constraint may be NDT, heat treat, autoclave, a test stand, a 5 axis machining center, or a specialized inspection resource.

    Capacity utilization measures how much of a plant’s total available capacity is being used, providing insights into production efficiency and potential growth opportunities. Asset utilization shows how often a critical asset is actively producing accepted output. Actual unit usage, planned time, operating time, idle time, and down time should be defined consistently, ideally using an ISO 22400 aligned model for manufacturing operations KPIs. The ISO 22400 KPI structure helps standardize these definitions.

    Sustained capacity utilization above 90 percent at the bottleneck is usually a warning. It may look efficient, but it often means queue growth, longer WIP age, and chronic lateness. Production efficiency is often measured by Overall Equipment Effectiveness (OEE), which evaluates how effectively a manufacturing operation is utilized by considering availability, performance, and quality.

    Overall Equipment Effectiveness (OEE) is a key manufacturing KPI that measures the percentage of planned manufacturing time that is productive, calculated by multiplying availability, performance, and quality. A legacy export may call the same metric overall equipment effectiveness oee; define it once and map it consistently. Overall equipment effectiveness is useful, but only when read with WIP age and schedule adherence.

    Connect981 combines routing data, machine events, planned versus actual run times, and supplier inputs to show real-time load versus capacity by line or cell. Real-time analytics in manufacturing allows for immediate insights into production processes, enabling quick decision-making and responsiveness to operational challenges.

    First Pass Yield and Rework-Driven WIP

    First Pass Yield (FPY) measures the percentage of products manufactured correctly without requiring rework, indicating the efficiency and quality of the production process. In aerospace and defense, typical first pass yield may sit in the 85 to 95 percent range, with mature world class processes above 97 percent, according to published manufacturing quality benchmarks such as TofuPilot’s FPY guide.

    FPY is not only a quality kpis measure. It is an execution KPI. Low pass yield adds routing loops, consumes inspection capacity, inflates WIP, raises production costs, and increases production cost per unit excluding materials. That exact unit excluding materials view is useful when rework labor and overhead are the main drivers.

    Rework Rate measures the share of products that require additional steps beyond the standard manufacturing process to meet quality standards, highlighting inefficiencies in production. Defect Density is a quality metric that tracks the number of defective products compared to the total volume of manufactured products, impacting profitability and customer satisfaction. Cost of Poor Quality (COPQ) shows the total financial impact of quality-related issues throughout the manufacturing process, including internal and external failure costs.

    In Connect981, NCR creation, defect logging, root cause analysis, and corrective action are tied to the original work order, serial number, operator, operation, and document revision. Root cause analysis helps identify repetitive delays in task completion such as waiting on parts or approvals. Material yield variance should also be visible when scrap or repair loops increase material consumption.

    On Time Delivery as the Ultimate Lagging Indicator

    On Time Delivery measures committed date versus actual ship date or internal completion date. Strong aerospace operations often target 95 to 98 percent on time delivery, while performance below 90 percent usually signals systemic risk. Benchmarks from supply chain performance research commonly place 95 percent and above in the strong range for industrial suppliers, as discussed in on time delivery metric guidance.

    OTD is critical, but it is lagging. By the time OTD drops, the execution problems are already inside current WIP. The practical question is not only “What shipped late?” It is “Which work orders in current WIP are already trending late?”

    Connect981 links live WIP age, queue time, capacity utilization, first pass yield, and schedule adherence to predicted OTD risk. Program managers can see risk by customer order and supplier before the miss occurs. That gives the team time to rebalance capacity, escalate parts, renegotiate dates, or isolate a quality issue.

    Review OTD weekly by program and supplier. Use flow KPIs daily to control the work that determines future OTD.

    Execution KPIs for Maintenance, Changeovers, and Unplanned Stops

    Work order visibility is incomplete if maintenance work orders, changeovers, and unplanned downtime sit outside the same execution layer. A production plan assumes manufacturing equipment is ready. A mechanical or electronic system that fails at the constraint can invalidate the plan in one shift.

    Improving work order visibility prevents maintenance bottlenecks, reduces downtime, and keeps teams aligned. Real-time analytics can enhance predictive maintenance strategies by using live data to identify potential equipment failures before they disrupt production. Manufacturers can enhance operational efficiency by implementing predictive maintenance strategies that utilize real-time data to identify parts needing replacement before they fail, thus minimizing downtime.

    In July 2026, a scheduled maintenance event on a 5 axis machining center should appear weeks ahead as planned capacity consumption. Planners can pull work forward, redirect WIP, or adjust supplier dates before the machine is unavailable. Scheduled maintenance, planned and unplanned downtime, production downtime, and changeover time belong on the same board as production work orders.

    Key maintenance and execution KPIs include:

    • Percentage Maintenance Planned, the share of planned maintenance hours compared with total maintenance hours
    • Maintenance Work Order Backlog Age, the age of open maintenance work orders affecting constraint assets
    • MTTR, the mean time to repair critical equipment and return to normal system operation
    • total maintenance cost divided by operating hours, cycles, or produced units
    • unit energy cost where energy intensive equipment affects cost and capacity
    • health and safety incidents when equipment condition or rushed recovery increases operational risk

    Real-time status updates and technician tracking eliminate downtime, allowing managers to dispatch personnel immediately.

    A maintenance technician is closely inspecting a large CNC machine within an aerospace factory, ensuring optimal performance and adherence to key performance indicators for manufacturing efficiency. The technician's focus on the equipment reflects the importance of maintaining production capacity and minimizing unplanned downtime in the manufacturing process.

    Percentage Maintenance Planned and Its Impact on Flow

    Percentage Maintenance Planned is planned maintenance hours divided by total maintenance hours. Aerospace teams often target 80 to 85 percent or higher. When PMP falls below about 70 percent, unplanned stops usually rise, WIP queues grow, and schedule adherence becomes less reliable.

    This is where production kpis and maintenance KPIs meet. A maintenance backlog on an autoclave, NDT booth, or test rig is not just an engineering issue. It is a work order visibility issue because it changes available capacity and delivery risk.

    Connect981 treats maintenance work orders as first-class execution objects. They have status, owner, priority, timestamps, reason codes, and asset impact. Leaders can see how PMP, unplanned downtime, maintenance cost, and production performance interact instead of reviewing maintenance and production in separate meetings.

    Changeover, Setup, and Execution Discipline KPIs

    In high mix aerospace environments, changeovers are frequent. Tooling swaps, fixture changes, document revisions, configuration differences, and inspection criteria all affect flow. A machine can be technically available while the work order sits in setup longer than planned.

    Track:

    • average changeover time by product family, line, and shift
    • worst-case changeover time, not only the average
    • schedule adherence on days with multiple changeovers
    • first pass yield after setup changes
    • production cost per unit excluding materials when setup labor drives cost

    Digital work instructions in Connect981 reduce setup variation by standardizing steps and ensuring technicians see the correct revision at the point of use. This protects quality control, reduces setup related rework, and improves manufacturing cycle efficiency.

    Which Dashboard Metrics Are Misleading (and What to Use Instead)

    Some dashboard metrics give a false sense of control. They may be useful in context, but they should not be treated as proof that work orders are under control.

    • Raw OEE without context. A constraint cell can show 92 percent utilization and good equipment effectiveness while backlog grows. Use OEE by constraint cell tied to WIP age, queue time, and schedule adherence.
    • Plant-wide utilization averages. A site average can hide one overloaded special process and several idle areas. Use capacity utilization by constraint, not only aggregate asset utilization.
    • Monthly scrap dollars only. Scrap dollars lag the issue and miss rework, inspection holds, and repair loops. Use first pass yield, Rework Rate, Defect Density, and COPQ by operation.
    • Total WIP value without age. Total WIP value does not show whether work is stuck in inspection, waiting for raw materials, or sitting at a supplier. Use WIP age buckets by routing operation.
    • Generic production volume. Units produced and produced units per week may look acceptable while the wrong orders are late. Use schedule adherence and OTD risk by customer program.
    • Cost-only views. Manufacturing cost per unit, total manufacturing costs, and cost per unit are important, but they do not explain flow. Pair cost metrics with live status and queue data.

    These are practical manufacturing kpi examples, but they work only when tied to work order status. Lean manufacturing kpis should make flow visible, not reward local optimization that damages the system.

    A McKinsey Industry 4.0 case study reported that end-to-end shopfloor visibility and standardized execution reduced subassembly WIP time from three days to four hours in two plants. The lesson is direct: visibility matters when it changes dispatching, ownership, and flow, not when it only improves a report.

    Designing a Work Order Status Model That Supports Visibility KPIs

    KPIs are only as good as the status model underneath them. If one cell uses “in progress” to mean setup, waiting for parts, and waiting for quality, cycle time and queue time become guesses.

    A simple status model should place every work order in exactly one state:

    • Planned
    • Released
    • In Setup
    • In Work
    • Waiting – Parts
    • Waiting – Quality
    • Waiting – Maintenance
    • Waiting – Document or Spec
    • Complete – Pending QA
    • Closed

    Each status should feed a metric. Waiting – Parts feeds material availability and supply chain performance. Waiting – Quality feeds FPY, inspection WIP, and quality loops. Waiting – Maintenance feeds PMP and MTTR. Waiting – Document or Spec matters in aerospace because routing sheets, FAI packages, NADCAP special process requirements, and engineering revisions must be controlled.

    The integration of real-time data collection systems in manufacturing helps eliminate manual data entry errors and provides accurate, up-to-date information for better operational decisions. Accurate data and reporting from centralized digital work orders create a reliable paper trail for analyzing historical data.

    Ownership, Timestamps, and Audit Trails

    Execution discipline requires clear ownership. A waiting status without an owner is only a label. Assign the responsible role: planner, cell lead, operator, quality inspector, maintenance technician, supplier contact, or program manager.

    Every status transition should capture:

    • owner
    • timestamp
    • reason code
    • affected operation
    • serial number or lot
    • document revision
    • digital signature where required
    • photo or attachment evidence where useful

    Digital audit trails track changes, sign-offs, and photo proof of completed work automatically, ensuring regulatory compliance. This matters for AS9100, FAA, EASA, ITAR, OEM audits, and NADCAP special processes. It also matters for daily management because accurate timestamps allow precise calculation of cycle time, queue time, WIP age, and schedule adherence without manual time studies.

    How Connect981 Gives You Real-Time Work Order Visibility Across Plants and Suppliers

    Connect981 sits above ERP, MES, QMS, PLM, supplier systems, and shopfloor inputs as a unified operations layer for aerospace manufacturing and MRO. It does not require teams to replace every core system before gaining visibility. It connects the work.

    Core capabilities include:

    • live WIP boards by cell, line, program, and supplier
    • digital work instructions with revision control
    • serial level traceability and parts history
    • real-time production kpis dashboards
    • NCR logging, quality checks, and corrective action workflows
    • supplier workflow integration and shared status
    • maintenance and production work orders in one execution view
    • AI assisted root cause analysis and predictive analytics

    Cross-functional dashboards allow stakeholders access to centralized information to track Key Performance Indicators (KPIs). A 2026 fuselage repair MRO shop can use Connect981 to see every work order’s current status, predicted completion date, missing documentation, open defects, and risk to turnaround time from one dashboard.

    The result is not just reporting. It is a shared operating model across manufacturing operations, maintenance, quality, supply chain, and program management.

    A quality inspector is closely examining an aircraft component using a handheld device to ensure it meets manufacturing quality control standards. This inspection is crucial for maintaining production efficiency and achieving key performance indicators in the manufacturing process.

    Role-Based Dashboards for Operations Leaders, Engineers, and the Shop Floor

    Different roles need different views, but they must come from the same work order data.

    A supervisor needs today’s dispatch list, blockers, overdue starts, and operator assignments. A plant manager needs WIP age, bottleneck queues, capacity utilization, production efficiency, and schedule adherence. A program manager needs on time delivery forecast, supplier risk, documentation readiness, and customer milestone impact. Manufacturing engineers need routing performance, setup variation, work instruction adoption, and continuous improvement signals.

    Connect981 supports zero code configuration, drag and drop workflow templates, and rapid deployment so manufacturing businesses can adjust workflows without waiting for a long MES replacement project. This is especially useful for manufacturing plant standardization across multiple sites and suppliers.

    True work order visibility is not measurement for its own sake. It is the daily operating system for disciplined execution. If your team needs one live view of WIP, bottlenecks, quality, maintenance, and supplier status, request a demo of Connect981.

  • AS9100 vs ISO 9001: What Changes for Nonconformance and Corrective Action in Aerospace?

    AS9100 vs ISO 9001: What Changes for Nonconformance and Corrective Action in Aerospace?

    Introduction: ISO 9001 Basics vs AS9100 Demands

    Most suppliers that understand iso 9001 already know the basic rhythm of a quality management system: define processes, control outputs, investigate failure, take corrective actions, and use the results for customer satisfaction and continuous improvement. ISO 9001 applies broadly to any industry and focuses on customer satisfaction and continuous improvement, which is why it works as a general quality management framework.

    AS9100D starts from that same foundation, but the aerospace industry raises the stakes. AS9100 incorporates the entirety of the ISO 9001 requirements while adding additional aviation, space, and defense industry-specific requirements, making it more stringent than ISO 9001. Both AS9100 and ISO 9001 emphasize the importance of a quality management system (QMS), but AS9100 includes specific requirements for risk management and product safety that are critical in aerospace manufacturing.

    This article looks at as9100 vs iso 9001 from the operational side: nonconformance, corrective action, supplier control, traceability, and audit evidence. From Connect981’s perspective, the useful question is not “Which certificate is better?” The useful question is: what changes on the shopfloor, in supplier collaboration, and in the nonconformance report when an organization moves into AS9100 expectations?

    Core Difference: AS9100 as ISO 9001 Plus Aerospace Requirements

    AS9100D is structurally built on ISO 9001:2015. It preserves the ISO clauses, including Clause 10.2 on nonconformity and corrective action, then adds industry specific requirements for aerospace work. In practice, AS9100 is ISO 9001 plus tighter controls for risk, product safety, configuration management, supplier oversight, counterfeit parts, and traceability.

    A simple high-level view:

    ISO 9001 introduces a generalized “risk-based thinking” approach, while AS9100 mandates a comprehensive risk management process. AS9100 also places a heavier emphasis on “Product Realization” and “Measurement, Analysis and Improvement” to meet regulatory demands. For suppliers, these key components change how nonconforming products are contained, investigated, documented, approved, and closed.

    AS9100 is often a mandatory requirement to act as a supplier for major aerospace OEMs. It also simplifies compliance with regulatory bodies like the FAA and EASA by providing a structured quality framework. That does not remove the need to meet regulatory requirements, but it gives the organization a disciplined quality system to prove compliance.

    An aerospace technician is carefully inspecting a machined component on a clean workbench, ensuring compliance with quality management system standards. The technician's focus on critical parameters reflects a commitment to product quality and continuous improvement in the aerospace industry.

    Side‑by‑Side: Nonconformity and Corrective Action (ISO 9001:2015 10.2 vs AS9100D 10.2)

    Both standards require documented procedures or controlled documented information for nonconformity and corrective action. The difference is depth. ISO 9001 tells the organization to establish processes for handling problems and improving effectiveness. AS9100 keeps that baseline and adds aviation, space, and defense expectations.

    In both standards, the nonconformance management process typically includes steps such as identification and reporting, documentation, containment, investigation, evaluation of impact, classification, and corrective and preventive actions (CAPA). Corrective actions are necessary to eliminate the root cause of non-conformances and restore compliance with quality management standards such as AS9100.

    ISO 9001:2015 – How Nonconformity and Corrective Action Work

    Under ISO 9001, a nonconformity occurs when a requirement is not met. That requirement may come from a customer, a regulatory body, an internal procedure, a drawing, a purchase order, or the standard itself. The expected flow is familiar:

    • Identify and report the issue.
    • Control and contain the affected output.
    • Determine the root cause.
    • Take appropriate corrective actions.
    • Review effectiveness.
    • Retain records of the nonconformance and results.

    Corrective actions should be based on a thorough root cause analysis to ensure that the underlying issues are addressed and do not recur in the future. Root cause analysis is essential for understanding why a non-conformance occurred and for developing lasting solutions, utilizing methodologies such as the 5 Whys, Fishbone (Ishikawa), or fault tree analysis. Fault tree analysis is a structured tree analysis method that can help determine how multiple process failures combined into one event.

    ISO 9001 expects internal audits and management review to confirm that problems were effectively addressed. The aim is promoting continuous improvement and continual improvement through evidence, not opinion. ISO 9001 recognizes that nonconformances may be severe or limited in scope, but classification details are largely left to the organization and certification body.

    ISO 9001 does not explicitly require aerospace-grade serial traceability, long program-life retention, or counterfeit-parts handling unless those needs come from customer or regulatory requirements. That is where AS9100 changes the operating model.

    AS9100D – Additional Requirements Around Nonconformance

    AS9100D retains the ISO 9001 process and adds aerospace-specific discipline. When the root cause involves people, AS9100 expects the analysis to consider human factors such as fatigue, workload, training, competence, or unclear work instructions. The investigation phase of the nonconformance management process determines the underlying root cause of the nonconformance using structured problem-solving tools, which is critical for implementing effective corrective actions.

    AS9100 also requires flow-down when the cause sits with an external provider. If a supplier ships material with missing certificates, performs an unapproved special process, or misses process requirements, the organization must issue a corrective action request, define responsible parties, track follow up, and escalate when supplier responses are late or weak. The implementation of corrective actions must be documented and tracked to ensure that they are effective and completed within established timelines.

    A machining example makes the gap clear. A shop finds that a gauge used on critical parameters was past calibration. Under ISO 9001, the shop contains the parts, checks impact, performs root cause analysis, and takes corrective action. Under AS9100, the shop also links affected parts by serial or lot, checks product safety and safety risks, updates risk assessments, evaluates whether FAI evidence is still valid, reviews configuration impact, and notifies relevant stakeholders if customer approval is required.

    Major vs Minor Nonconformance: What Changes Under AS9100?

    Suppliers moving from ISO 9001 to AS9100 will see familiar terms: minor nonconformances, major nonconformance, and in some systems critical nonconformance. Nonconformances are classified as minor, major, or critical based on their impact on product quality, safety, and regulatory compliance, with each classification requiring different levels of investigation and corrective action.

    In AS9100 audits, the threshold for severity is tighter because the consequence of failure is different. A documentation miss may look small until it breaks traceability. A supplier flow-down miss may look administrative until it allows an unapproved special process. A late calibration may become major if the measurement device controlled flight-critical dimensions.

    Examples suppliers should treat carefully:

    • A late calibration on a gauge used for critical parameters can become a major issue if conformity cannot be proven.
    • An incomplete inspection record on a low-risk feature may remain minor if traceability and impact are clear.
    • Missing supplier flow-down of an OEM specification is often serious because the supply chain cannot prove applicable requirements were met.

    In 2019, a total of 17,184 nonconformances were recorded across AS9100 standards, with 15,298 classified as minor and 1,886 as major, highlighting the prevalence of nonconformities in the aerospace sector. Industry reporting through systems such as IAQG OASIS shows why audit findings around NCR closure, supplier control, and traceability receive close attention.

    Nonconformance Control in Aerospace: Traceability, Counterfeit Parts, and Supplier Flow‑Down

    This is the heart of as9100 vs iso 9001 for non conformance control. AS9100 requires nonconformance records to connect the defect, part, configuration, supplier, inspection evidence, and disposition. Informal email chains are rarely enough.

    AS9100 requires deep traceability of raw materials from creation to the final component, often retaining records for decades. AS9100 requires absolute lot traceability from raw material to final delivery, so an NCR should identify the affected lot, serial number, work order, routing step, inspection point, and disposition authority. Thorough documentation of nonconformances is critical for maintaining data integrity and supporting root cause analysis, as incomplete or inaccurate documentation can compromise investigations and lead to ineffective corrective actions.

    AS9100 also requires organizations to have a more detailed approach to supplier management compared to ISO 9001, reflecting the complexities and risks associated with aerospace supply chains. When nonconformance originates outside the four walls, the supplier needs structured communication, evidence, corrective action expectations, and closure criteria.

    Traceability Expectations Beyond ISO 9001

    AS9100 elevates traceability from a useful control to an aerospace operating requirement. Measurement traceability, calibration records, inspection results, revision status, and material pedigree must remain connected. AS9100 requires a formal system to track and control the configurations of a product throughout its lifecycle. AS9100 requires rigorous configuration management to control design changes, parts validation, and build histories.

    AS9100 specifically requires First Article Inspection (FAI) to validate that production processes meet design requirements. When a nonconformance affects a first article characteristic, build record, or MRO maintenance history, the organization must determine whether previous approvals still stand.

    An effective documentation system is essential for managing nonconformities and corrective actions, facilitating traceability, accountability, and continuous improvement. Documentation ensures that all relevant details of identified nonconformities are formally recorded in a controlled and traceable manner, establishing an auditable record for assessment and resolution. In practice, that means disciplined document control, controlled work instructions, approved rework procedures, and records that can survive customer audits years later.

    An inspector is carefully reviewing the measurements of an aerospace part while surrounded by calibrated tools, emphasizing the importance of quality management systems and regulatory compliance in the aerospace industry. This scene highlights the critical parameters necessary for ensuring product quality and customer satisfaction through effective corrective actions and continuous improvement processes.

    Counterfeit Parts and High‑Risk Nonconformances

    Counterfeit parts in aerospace include unauthorized copies, components with misrepresented sources, altered markings, tampered certificates, or uncertified parts sold as approved material. AS9100 mandates strict processes to detect and prevent counterfeit or uncertified components in the supply chain. AS9100 mandates rigorous controls to detect and prevent the use of counterfeit or unapproved components.

    AS9100 requires clear processes to identify, quarantine, investigate, and report suspected counterfeit parts as part of the nonconformance workflow. If a distributor cannot produce adequate certificate of conformity or raw material pedigree, the appropriate actions are not limited to asking for a better PDF. The supplier should segregate the material, block use, assess impact, notify the customer when required, and prevent recurrence through supplier approval or procurement controls.

    These are high risk events because they can affect product quality, product safety, and regulatory compliance at the same time. AS9100 requires documented processes for assessing and mitigating safety risks across the entire product lifecycle. AS9100 helps reduce failures in critical aerospace components due to its stringent focus on risk management.

    Process Integration: Internal Audits, Management Review, and Document Control Under AS9100

    In AS9100, NCRs and corrective actions are not isolated quality records. They feed the audit program, management review, supplier scorecards, risk registers, configuration control, and preventive measures. The point is not only to restore compliance. The point is to eliminate underlying causes and reduce future occurrences.

    Internal audits should sample NCRs, CAPAs, supplier-caused failures, and disposition approvals. Auditors will ask whether the organization can show containment, impact analysis, objective evidence, and effectiveness checks. They will also look for updating risks when serious events expose weak controls.

    Internal Audits and Follow‑Up on Corrective Actions

    A practical AS9100 internal audit should ask:

    • Was the nonconformance report complete, accurate, and linked to the affected product?
    • Were nonconforming products identified and controlled before release?
    • Did the organization determine the root cause using evidence?
    • Were appropriate corrective actions assigned to responsible parties?
    • Were supplier corrective actions flowed down when needed?
    • Was effectiveness verified after implementation?

    Effective root cause analysis helps prevent recurrence of issues by addressing fundamental problems, ensuring that corrective actions are based on evidence and a clear understanding of the sequence of events that led to the nonconformance. To implement effective corrective actions, the quality team must verify that the fix worked in production, not just that the form was closed.

    Internal audit findings often become inputs into the same corrective action system. That is healthy. It means the process is connected and preventive action is based on evidence rather than memory.

    Management Review, Risk, and Continuous Improvement

    AS9100-driven management review should include NCR volume, recurring defects, overdue corrective actions, supplier-related issues, customer complaints, major events, and trend data. Leadership should evaluate whether the current quality management process can handle aerospace risk levels, then allocate training, tooling, inspection, or supplier development resources.

    For example, if management review shows repeated dimensional escapes from one work center, the appropriate response may include retraining, revised work instructions, gauge replacement, and a new in-process inspection gate. If supplier NCRs concentrate around one commodity, procurement may need to change approved suppliers or tighten contract review.

    This is where continuous improvement becomes operational. Recurring nonconformance themes should become formal improvement work with owners, due dates, metrics, and follow up. The goal is not more paperwork. The goal is a stronger process that helps the organization meet customer, regulatory, and program obligations.

    Practical Transition Guidance for Suppliers Moving from ISO 9001 to AS9100

    The usual gap is not that ISO 9001 suppliers lack procedures. The gap is that the procedures are not always deep enough for aerospace evidence, traceability, supplier risk, and configuration control.

    Start with a focused gap analysis:

    1. Review Clause 8 operation controls, especially production, release, and nonconforming output.
    2. Review Clause 8.4 for external providers, supplier risk, flow-down, delivery performance, and subcontractor oversight.
    3. Review Clause 10.2 for nonconformity and corrective action, human factors, supplier CAPA, and effectiveness.
    4. Review traceability from raw material through final delivery.
    5. Review counterfeit parts prevention, especially approved sources and certificate controls.

    Then upgrade the actual workflows. NCR forms should capture part number, revision, serial or lot, work order, inspection station, measurement results, disposition, approval evidence, and risk impact. Corrective action workflows should define classification, containment, investigation, implementing corrective actions, verification, and closure. Training should cover counterfeit parts, configuration management, measurement traceability, human factors, and when to escalate to customers or a regulatory body.

    The practical interpretation is straightforward: AS9100 expects the supplier to prove control, not simply describe intent.

    Where a Digital Operations Layer like Connect981 Helps

    Connect981 is an aerospace operations platform built for connected shopfloor work, supplier collaboration, and audit-ready execution. It can support AS9100 nonconformance control without forcing a complete MES or ERP replacement.

    In Connect981, teams can centralize NCRs, corrective actions, and follow up across factories and suppliers. Records can link to work orders, serial numbers, inspections, supplier data, digital work instructions, and document revisions. That matters when auditors ask for accurate documentation or when a customer wants to know exactly which parts, lots, and configurations were affected.

    The platform supports document control for work instructions and NCR forms, traceability and serial management, quality checks, defect logging, supplier workflow integration, and real-time reporting. AI-assisted root cause analysis and production analytics can help teams detect recurring patterns earlier, whether the pattern is supplier-caused, process-driven, or related to human factors.

    A factory operator is seen using a tablet while standing next to an aerospace assembly workstation, where they likely monitor quality management system processes and implement corrective actions to ensure compliance with industry-specific requirements. The operator's focus on continuous improvement and effective documentation highlights their role in maintaining product quality and customer satisfaction in the aerospace industry.

    For suppliers comparing as9100 vs iso 9001, the operational takeaway is clear: AS9100 does not replace the ISO 9001 foundation. It tightens it for aerospace risk. If your team needs stronger NCR workflows, supplier corrective action visibility, and digital traceability across production and MRO operations, request a demo of Connect981 to see the workflows in context.

  • CAPA in Aerospace: When to Start, What to Prove, and How to Close

    CAPA in Aerospace: When to Start, What to Prove, and How to Close

    CAPA aerospace workflows are often discussed only after something has already gone wrong: a recurring nonconformance, an audit finding, a supplier escape, or a field event that raises airworthiness concern. The issue is rarely the form itself. The issue is whether the organization knows when CAPA begins, what evidence belongs in the file, and what proves the fix actually worked.

    In aerospace manufacturing and MRO, CAPA is not a paperwork exercise. It is a controlled process for turning quality data into permanent solutions. Done well, it connects NCRs, MRB decisions, inspections, supplier records, customer feedback, and field events into one practical process for risk reduction and continuous improvement.

    An aerospace inspector is examining a machined component on a clean production floor while using a tablet, highlighting the importance of quality management systems and the effective CAPA (Corrective and Preventive Actions) process in ensuring regulatory compliance and continuous improvement in aerospace manufacturing.

    What is CAPA in Aerospace Manufacturing and MRO?

    CAPA stands for Corrective and Preventive Action. In practice, it means corrective and preventive actions taken through a formal, evidence based workflow. Corrective actions address known quality problems and prevent recurrence. Preventive actions address related risks before they become quality defects, escapes, or safety events.

    CAPA is familiar in medical devices, medical device manufacturing, and the way medical device companies manage quality system obligations under federal regulations. Medical device manufacturers often face strong regulatory scrutiny around CAPA documentation, root cause determination, and effectiveness checks. Aerospace has a different operating environment, but the expectation is similar: a capa process must be traceable, risk based, and supported by evidence.

    In aerospace production and MRO, CAPA sits inside the quality management system. It connects nonconformance reports, MRB decisions, internal audits, supplier issues, customer escapes, service difficulty signals, and field events into a closed loop. It is not just a qms capa record. It is the mechanism for proving that the production process, maintenance process, or supplier process has been brought back under control.

    AS9100D Clause 10.2 expects organizations to react to nonconformities, determine root cause, consider whether similar nonconformities exist, implement corrective actions, and evaluate effectiveness. FAA and EASA regulatory requirements, NADCAP special process expectations, and customer quality clauses all point toward the same operating truth: an effective capa system must produce records that show what happened, why it happened, what changed, and whether the change worked. Guidance on AS9100D nonconformity and corrective action requirements is summarized by AS9100 Store.

    Connect981 provides the digital backbone for this work across factories, suppliers, and MRO facilities. Instead of tracking a capa plan through spreadsheets, email threads, local folders, and disconnected quality systems, teams can link defects, inspection evidence, owners, action plans, change control, and closure evidence in one shared workflow.

    When Should a CAPA Be Opened in Aerospace Operations?

    A CAPA should be opened when the evidence points beyond a single defect and toward systemic issues, repeat risk, regulatory impact, or significant safety and airworthiness concern. CAPA does not begin automatically every time an NCR is written. A one off nonconformance can often be handled through NCR, MRB disposition, containment, and correction.

    The decision changes when the same type of problem repeats, when a single event has high consequence, or when an audit finding shows a weakness in the quality management process. In those cases, a corrective action plan is needed because the organization must understand root cause and change the system, not just fix the affected part.

    Under using CAPA hides systemic risk. Overusing CAPA creates noise, delays, and long backlogs that prevent the team from focusing on high risk issues. The best capa procedures use risk based prioritization. They define when the CAPA threshold has been met, who approves the decision, what evidence is needed, and how capa outcomes will be measured.

    Connect981 supports this decision by reading across NCRs, defects, rework, supplier records, audit findings, and process data. The platform can surface capa trends and AI assisted root cause signals so quality leaders can see whether an issue is isolated or part of a wider pattern.

    Trigger Logic: Clear Criteria for Opening a CAPA

    Aerospace organizations should document CAPA trigger logic in their procedures and configure it into the capa system. The decision should not depend on who happens to be reviewing the issue that day. It should be consistent, auditable, and aligned with regulatory expectations.

    Common CAPA triggers include:

    • Repeated nonconformances on the same part family, feature, process, work center, tool, or supplier within a defined period. A practical threshold is three similar NCRs within 90 days, although each organization should set criteria based on its own processes and risk profile.
    • A serious quality escape affecting delivered aircraft, flight hardware, maintenance release, or customer safety. Structural fastener torque issues discovered after delivery should trigger CAPA immediately.
    • Internal audits, AS9100 audits, NADCAP audits, FAA or EASA findings, or customer audits that identify systemic weakness or repeated minor findings in the same area.
    • A high Risk Priority Number from FMEA, a severe risk assessment outcome, or risk analysis showing that even a single occurrence could affect airworthiness, compliance, or mission reliability.
    • Supplier quality problems involving safety critical parts, long lead components, counterfeit risk, traceability gaps, or repeated documentation failures.
    • Customer feedback showing recurring escapes, late corrective measures, or dissatisfaction tied to the same process weakness.
    • Negative trend data in scrap, rework, inspection failures, test failures, MRO turnaround delays, or supplier controls.

    A CAPA trigger does not mean the answer is already known. It means the organization has enough evidence to justify a thorough investigation. In Connect981, these criteria can be built into configurable workflows so recurring defects, supplier performance drops, or high risk issues are flagged before they become audit findings or customer escapes.

    Examples: When Immediate Correction Is Enough vs. When CAPA Is Required

    A single routing sheet error may not justify CAPA. If one work order has an incorrect router code, the affected record can be corrected, the lot can be reviewed, and the operator or planner can be briefed. If there is no trend, no safety impact, and no evidence of a broken planning process, an NCR and correction may be enough.

    A recurring torque verification gap is different. If three work orders for the same part family show missing torque verification on critical structural fasteners, the issue has moved beyond correction. The capa investigation should review work instructions, tooling, inspection points, training, human factors, and whether the router allows the operation to be skipped.

    Supplier labeling follows the same logic. One mislabeled shipment of non flight hardware may be handled through MRB, receiving inspection, and supplier notification. Multiple mislabels from the same supplier over two months point to supplier process weakness. That requires CAPA, supplier corrective actions, and likely a preventive action plan covering similar part families or packaging flows.

    A field event can trigger CAPA without waiting for recurrence. If an aircraft or engine assembly shows a structural issue after delivery, the organization should open CAPA based on risk, not count. Connect981 helps by showing recurrence across shops, suppliers, programs, and MRO stations, giving quality teams the evidence to justify escalation.

    How CAPA Differs from NCR, MRB, and Immediate Containment

    CAPA is often confused with NCR, MRB, and containment because all four may appear in the same quality event. They are connected, but they do different work.

    • Nonconformance Report, or NCR: The NCR is the initial record of a defect or deviation on a part, assembly, process, document, or maintenance task. It often applies to a single work order, batch, serial number, or inspection record.
    • Material Review Board, or MRB: MRB is the engineering and quality decision process for dispositioning nonconforming product. Typical dispositions include use as is, repair, rework, scrap, or return to supplier. MRB decides the fate of product. It does not, by itself, solve the process failure.
    • Immediate containment or correction: Containment protects the customer, the aircraft, and production flow while the facts are being established. Examples include quarantine, stop use, stop shipment, added inspection, temporary rework, and suspect lot review.
    • CAPA: CAPA sits above NCR and MRB. It is triggered when data from those processes show deeper process failure, repeat risk, regulatory compliance exposure, or safety concern.

    The distinction matters. Containment may stop the bleeding, but it does not prove the root cause has been removed. MRB may release or scrap hardware, but it does not verify effectiveness of a process change. CAPA is the closed loop record that shows root cause, corrective or preventive actions, implementation evidence, and capa effectiveness.

    Connect981 links NCRs, MRB decisions, containment tasks, and CAPA records so teams can see the full chain from first defect through confirmed root cause and long term fix. The result is better traceability and fewer gaps during regulatory inspections.

    Practical Process Flow: From Deviation to CAPA

    A practical process keeps the handoffs clear:

    • Defect or deviation is logged as an NCR with part number, serial number, operation, work order, inspector, and evidence.
    • MRB reviews the affected product and determines disposition, such as rework, repair, scrap, use as is, or return to supplier.
    • Immediate containment protects the customer and production flow. Suspect inventory may be quarantined, shipments paused, or inspection expanded.
    • Quality performs trend review and risk assessment using NCR history, process data, audit findings, supplier records, and customer feedback.
    • CAPA is opened if trigger criteria are met. The capa owner is assigned, scope is defined, and the capa form becomes the umbrella record.
    • The investigation aggregates NCRs, MRB records, inspection results, supplier inputs, engineering analysis, and production evidence.
    • Corrective actions and preventive measures are implemented, verified, monitored, and reviewed for closure.

    In Connect981, this flow is modeled as linked digital workflows. Teams avoid duplicate data entry, evidence remains connected to the original event, and the audit trail is built as the work happens.

    A quality engineer is inspecting aerospace fasteners at a workstation, while digital records are displayed on a tablet, highlighting the importance of a quality management system in ensuring regulatory compliance and effective corrective actions. The scene emphasizes the role of continuous improvement and thorough investigation in the aerospace industry.

    The CAPA Investigation: Root Cause, Evidence, and Action Planning

    A real capa investigation starts with a clear problem statement. The statement should describe what failed, where it failed, when it was found, how many units were affected, which requirements were missed, and why the issue matters. Vague language creates weak investigations. A well documented CAPA file begins with operational facts.

    The investigation then defines scope. That includes affected parts, programs, suppliers, work centers, shifts, tools, routers, inspection points, MRO tasks, and potentially delivered product. The team should also evaluate whether similar nonconformities exist elsewhere. AS9100D expects this broader check, not only a review of the visible defect.

    Aerospace CAPA cannot stop at “operator error.” Human factors matter, but they must be examined in context. The team should review instruction clarity, training records, tooling condition, calibration, access to current revisions, environmental conditions, supervision, inspection plans, supplier controls, and change control history. EASA Part 145 environments also expect root cause and contributing factor analysis for findings, as summarized in industry guidance on aviation maintenance root cause analysis.

    Each CAPA should document the problem statement, scope, data sources, root cause analysis, corrective actions, preventive actions, and effectiveness verification plan. Connect981 keeps photos, NCRs, SPC charts, supplier emails, FAI reports, calibration logs, and revised work instructions linked to the CAPA record for fast retrieval during audits.

    Root Cause Analysis in Aerospace CAPA

    Root cause analysis is a disciplined method for separating symptoms from causes. It should be practical, not theatrical. The goal is root cause determination that can be tested against evidence and translated into corrective measures.

    Useful methods include:

    • 5 Whys for straightforward process breakdowns, such as a skipped verification step.
    • Fishbone or Ishikawa analysis for issues with multiple contributing factors, such as plating defects involving chemistry, tooling, handling, and inspection.
    • fault tree analysis for safety critical failures where event logic and failure paths must be understood.
    • FMEA review when the failure mode was known but risk management controls did not prevent occurrence or detection failure.
    • Process mapping when handoffs between planning, stores, inspection, MRO, or supplier teams are unclear.

    CAPA should involve cross functional teams when the issue crosses boundaries. A cross functional team may include quality, manufacturing engineering, design engineering, production, MRO leads, supply chain, supplier quality, and program management. In high consequence cases, organizations should involve cross functional teams early so the investigation does not optimize one department while missing the system failure.

    Connect981 can support RCA by surfacing similar events, defect history, supplier patterns, and prior capa actions. AI assisted root cause suggestions can point teams toward likely contributing factors, but the decision remains with engineering and quality. The confirmed root cause must be supported by evidence.

    Evidence Requirements: What Belongs in CAPA Documentation

    Good capa documentation tells a coherent story. An auditor, customer representative, or new quality manager should be able to understand what happened, why it happened, what changed, and how the organization verified the result.

    Typical evidence includes:

    • NCR history and defect records.
    • Scrap, rework, and repair trends before and after the event.
    • Inspection results, SPC charts, capability studies, and test data.
    • Photos, microscopy, measurement reports, or lab results showing the defect.
    • Calibration records, tool maintenance logs, and gage records.
    • Training records, qualification sign offs, and skill matrix updates.
    • Revised digital work instructions, routers, inspection plans, and control plans.
    • Change control approvals, ECOs, drawing updates, software revisions, or CNC program validation.
    • First Article Inspection records when the process or configuration changed.
    • Supplier corrective action reports, supplier audits, and receiving inspection evidence.
    • Risk assessment, risk analysis, and FMEA updates.
    • CAPA review notes, approvals, and management review inputs when appropriate.

    Each root cause should have supporting evidence. Each corrective action and preventive action capa item should also have proof that it was implemented. If the fix was an updated torque specification, the CAPA file should link to the approved specification, revised router, updated work instruction, and evidence that the station is using the current revision.

    Connect981 acts as a single evidence repository across ERP, MES, PLM, QMS, and supplier data. This matters because CAPA evidence often lives in fragments. One piece is in email, another in a file share, another in a supplier portal, and another on the shopfloor. Fragmented evidence creates audit risk even when the team did the right work.

    A cross-functional aerospace quality team is reviewing component inspection results beside a production cell, focusing on implementing corrective and preventive actions as part of their quality management system. They are engaged in root cause analysis to ensure continuous improvement and prevent recurrence of quality defects in the manufacturing process.

    Building the CAPA Action Plan

    The capa plan translates root cause findings into specific action plans. It should separate correction from corrective action. Correction fixes the affected part or record. Corrective action changes the system so the issue does not recur. A preventive action plan extends the lesson to similar risks elsewhere.

    An aerospace CAPA action plan may include:

    • Process changes to routing, inspection sequence, traveler logic, or MRO task flow.
    • Procedure updates and revised digital work instructions.
    • Tooling changes, fixture improvements, calibration frequency changes, or gage updates.
    • Training tied to the revised process, not generic retraining.
    • Supplier development, supplier audits, or updated purchase order quality clauses.
    • Design changes, ECOs, configuration updates, or FAI requirements.
    • Additional controls for detection, such as automated verification, required signoffs, or inspection hold points.

    Every action should have an owner, due date, risk priority, required evidence, and acceptance criteria. The capa owner should not be left to chase status manually through email. Capa management works best when ownership, escalation, and evidence expectations are visible from the start.

    Connect981 provides configurable CAPA forms with action tables, owner assignment, e signatures, due dates, escalation logic, and links to downstream change control and validation activities. This supports implementing corrective actions without losing the connection between the root cause and the work being done.

    Effective CAPA Closure: What “Done” Really Looks Like

    Effective capa closure is not the point where tasks are checked off. It is the point where evidence shows the issue is controlled and unlikely to recur within defined risk limits. That is the difference between activity and control.

    A strong capa program defines closure criteria before closure begins. For example, the organization may require three consecutive production lots with zero repeat defects, 90 days without a similar NCR, a successful internal audit of the revised process, or verified supplier performance after corrective action. The criteria should match the severity and risk of the issue.

    Cosmetic closure is a common failure. A document is updated, a training record is signed, and the CAPA is closed before the production process proves stability. That approach does not satisfy regulatory expectations. It also fails operations because recurrence returns the same problem to the same people weeks later.

    Aerospace teams should use plan do check act thinking. Plan the CAPA, do the implementation, check performance against evidence, and act again if the data shows the fix did not hold. This is where capa effectiveness is proven. Connect981 can automate effectiveness tracking using real production and inspection data, then prompt the capa owner when enough evidence is available for closure review.

    Closure Evidence: Proving the CAPA Worked

    Closure evidence should prove that the action was implemented and that it worked. Auditors and OEM customers are not looking for a clean form. They are looking for evidence of a controlled process.

    Useful closure evidence includes:

    • Before and after trend charts showing reduced defect rate, scrap, rework, or escapes.
    • Zero repeat NCRs for the same issue over a defined time period or production quantity.
    • Successful FAI after a process, tooling, or configuration change.
    • Audit reports confirming that operators are using the revised procedure or work instruction.
    • Approved ECOs, updated drawings, released routers, revised inspection plans, and current digital work instructions.
    • Validated CNC, test rig, inspection, or software program changes where applicable.
    • Training completion records tied to the exact revised process.
    • Supplier performance records showing the same defect has not recurred.
    • Updated FMEA, risk controls, control plans, or inspection frequency.
    • Formal capa review sign off by the quality manager, CAPA board, or authorized approver.

    The CAPA review should confirm that the root cause logic is sound, the risk assessment remains valid, the actions match the cause, and the effectiveness data is sufficient. If the evidence is weak, the CAPA should remain open. If recurrence appears, the team should reopen the investigation or launch a new CAPA with the prior failure included in the analysis.

    Connect981 presents closure packets and dashboards that show timelines, action status, evidence links, trend plots, and approval history. This helps quality leaders verify effectiveness without rebuilding the story from scattered records.

    Integrating CAPA with Change Control, Quality Management, and Suppliers

    CAPA does not operate alone. It is part of quality management, risk management, supplier management, configuration control, and production execution. Many capa actions require formal change control because they affect routers, work instructions, inspection plans, tooling, software, drawings, or maintenance procedures.

    That integration is where many organizations struggle. A CAPA may require an updated work instruction, but the change is released only in a document system and never reaches the station. A supplier may submit a response, but receiving inspection does not change its sampling plan. An engineering change may be approved, but the FAI requirement is missed. These are not individual failures. They are workflow gaps.

    CAPA should connect to:

    • Internal audits and audit finding closure.
    • FAI and production readiness.
    • Configuration management and engineering change control.
    • MRO maintenance records and parts history.
    • Supplier portals, supplier corrective actions, and procurement workflows.
    • Training and qualification management.
    • Management review, especially for repeated or high severity capa trends.

    Connect981 links CAPA to change control workflows, supplier collaboration, and real time shopfloor execution. Approved changes can be pushed to the right workstations, suppliers, and inspection points with revision control. The organization can then show not only that the CAPA was approved, but that the approved process reached the people doing the work.

    Digital CAPA Systems in Aerospace: From Paper to Connected Workflows

    Paper and spreadsheet based CAPA tracking can work for a small volume of simple issues. It breaks down when operations span multiple sites, suppliers, product lines, and regulatory obligations. The problem is not just administration. The problem is weak data continuity.

    An effective capa system gives teams a single source of truth for CAPA documentation, owners, due dates, evidence, approvals, and closure status. It also supports automated reminders, escalations, consistent templates, electronic signatures, and audit ready traceability. In practice, this reduces time spent searching for records and increases time spent solving the actual problem.

    A connected digital system should support:

    • Linked NCR, MRB, containment, CAPA, and closure records.
    • Real time dashboards for open actions, aging, risk level, and overdue items.
    • Cross site capa trends and supplier performance visibility.
    • Configurable capa procedures that reflect the organization’s quality system.
    • AI assisted root cause analysis and production quality insights.
    • Integration with ERP, MES, PLM, QMS, supplier portals, and shopfloor execution.
    • Evidence capture from photos, inspections, calibration records, training, and change approvals.

    Technology does not replace judgment. It helps the organization make good judgment repeatable. Connect981 is built for aerospace manufacturing and MRO teams that need CAPA connected to real work: digital work instructions, quality checks, supplier collaboration, traceability, routing, and compliance records.

    For aerospace manufacturers and MRO providers looking to standardize CAPA, reduce regulatory compliance risk, and close the loop from defect to verified improvement, Connect981 provides a practical path. Request a demo to see how an integrated CAPA workflow can connect NCRs, MRB decisions, root cause analysis, change control, supplier actions, and effectiveness verification in one operational layer.

  • Material Review Board (MRB) in Aerospace – Dispositions, Authority, and Digital Traceability

    Material Review Board (MRB) in Aerospace – Dispositions, Authority, and Digital Traceability

    In aerospace, a small defect can become a large decision. A burr, porosity indication, missing certificate, corrosion finding, or dimensional deviation can affect safety, delivery, cost, and configuration control. That is why mrb aerospace processes need clear authority, disciplined evidence, and traceable execution.

    Overview: What Is an Aerospace Material Review Board (MRB)?

    A material review board is a controlled authority for evaluating nonconforming material, components, assemblies, raw materials, and records. A Material Review Board (MRB) is a cross-functional team that evaluates nonconforming materials to determine their fate, ensuring decisions are based on quality and safety considerations.

    The material review board MRB is not just a meeting held on a weekly or monthly basis. It is a material review board process embedded in daily operations across OEMs, Tier 1 suppliers, and MRO organizations. It connects the non conformity report, concessions, deviations, engineering analysis, production data, and final disposition.

    Do not confuse this with the Maintenance Review Board (MRB), which governs scheduled fleet-wide maintenance standards in aviation, playing a critical role in maintaining airworthiness. The aerospace material review function focuses on product nonconformance and whether the affected item can move forward.

    AS9100 and regulatory expectations require nonconforming product to be identified, reviewed, approved, and documented by authorized personnel. FAA guidance such as FAA Order 8120.23 reinforces the need for defined MRB authority and objective records.

    Connect981 supports this work by tying ERP, MES, QMS, supplier, and shopfloor data into one traceable mrb process, so the current mrb record is not scattered across emails or shared folders.

    A technician is carefully inspecting an aircraft component on a clean shop floor, ensuring adherence to quality assurance standards. This process is part of the material review board (MRB) procedure, where nonconforming materials are evaluated to determine their disposition and prevent future nonconformance.

    Who Sits on the MRB and What Authority Do They Have?

    An MRB must consist of highly specialized subject matter experts, including stress engineers, quality assurance specialists, and design engineers. The board members usually come from different departments because one function rarely has enough context to decide alone.

    Typical roles include:

    • Quality assurance lead or chair: controls the process, verifies containment, ensures records are complete, and confirms the decision follows procedure.
    • Quality engineers: review inspection evidence, defect history, customer requirements, and audit risk.
    • Design engineer: determines whether the condition affects form, fit, function, or approved design intent.
    • Stress or structural engineer: evaluates metal fatigue, stress loads, damage tolerance, residual margin, and primary structure impact.
    • Manufacturing engineer and mrb engineers: define whether repair or rework can be performed with approved resources, tooling, and instructions.
    • Procurement and supplier quality: coordinate vendor communication, supplier corrective action, and return to vendor disposition.
    • Production or MRO operations: explain routing impact, aircraft access, priority, and cycle time constraints.

    Authority is delegated through a charter, quality manual, customer agreement, or engineering authority letter. Local boards may decide minor issues. Major or safety-critical deviations often require OEM, customer, FAA, or EASA approval. MRB teams are responsible for keeping manufacturing and production lines running smoothly while adhering to stringent structural and airworthiness standards, but they must still challenge schedule pressure when conformity or safety is at risk.

    MRB Process Flow: From Detection to Final Disposition

    The MRB process typically begins with the creation of a Nonconformance Report (NCR) when a defect is identified, which is then reviewed by the board to decide on the appropriate disposition of the nonconforming materials.

    1. Detection: issues may come from incoming inspection, in-process checks, NDT, functional test results, final inspection, supplier notice, or MRO discovery.
    2. Containment: parts are quarantined, tagged “HOLD” or “DO NOT USE,” and blocked in ERP, MES, or WMS to prevent shipment or installation.
    3. NCR creation: the condition is described as is, linked to part number, serial or lot, work order, routing, supplier, photos, inspection reports, and test data.
    4. MRB review: board members examine drawings, specifications, process history, prior nonconformance report records, allowable damage limits, and mrb evidence.
    5. Evaluation: the group must determine whether data is sufficient or insufficient, whether extra inspection is needed, and whether the issue can affect aircraft safety.
    6. MRB decision: the board selects a disposition, defines actions, and records who must approve, perform, and verify the work.
    7. Execution and closure: routing, work instructions, reinspection, supplier response, or scrap controls are completed before closure.
    8. Feedback: recurring issues are linked to corrective action to prevent recurrence.

    In Connect981, this flow is captured in one controlled record, visible to quality, engineering, production, procurement, and suppliers.

    Standard MRB Disposition Paths in Aerospace

    Common dispositions made by the MRB include accepting materials as-is, reworking them, returning them to the vendor, or scrapping them if they cannot be corrected. The Material Review Board (MRB) can recommend several dispositions for nonconforming materials, including use as-is, rework, return to vendor, and scrap.

    • Use as is: If the nonconformity does not affect the product’s form, fit, or function, the MRB may decide to accept the item as-is, which is also known as accepting under concession. In aerospace, this requires engineering rationale and, for structural items, stress review.
    • Rework: When a part is found to be defective, the MRB may determine that it can be reworked to meet the original specifications, provided that the costs and time involved do not disrupt the production process. Rework returns the item to drawing compliance.
    • Repair: Repair is an approved deviation from the original design, such as blended damage, bushings, patches, or doublers. Strict regulatory compliance involves ensuring every repair disposition meets airworthiness standards set by authorities like the FAA and EASA.
    • Regrade or downgrade: materials may move to a lower-criticality use only when allowed, relabeled, and configuration records are updated.
    • Return to vendor: In cases where the defects are significant and affect the product’s quality, the MRB may recommend returning the materials to the vendor for corrective action.
    • Scrap: If the defective materials cannot be reworked or returned, the MRB may decide to scrap them, especially if the financial and time loss does not justify rework or return. Scrap must be documented by quantity, serial, and destruction status.

    Every disposition needs rationale, risk level, required follow-up, and approval trace.

    Material Review Board Documentation and Traceability Requirements

    Each mrb record should include NCR number, part number, serial or lot number, work order, affected aircraft or engine registration for MRO, defect description, detection point, responsible organization, drawings, specifications, and revision levels.

    Evidence includes inspection reports, NDT images, measurement data, supplier certificates, photos, test logs, stress calculations, and engineering approvals. Effective MRB practices require that all decisions regarding nonconforming materials are defensible, meaning that the rationale for each decision must be recorded contemporaneously and linked to objective evidence, ensuring compliance with regulatory standards.

    Traceability must run backward to materials, suppliers, processes, and approved data, and forward to affected assemblies, aircraft, customers, and as-maintained configuration.

    Regulatory requirements mandate that nonconformances are investigated, decisions are justified, and records are complete, particularly in industries such as pharmaceuticals and medical devices, which are governed by 21 CFR regulations. The Material Review Board (MRB) process must integrate with quality management systems to ensure that all decisions regarding nonconforming materials are documented with objective evidence, including e-signatures and secure audit trails, as required by regulations like Part 11 and Annex 11.

    Compliance gaps can arise when MRB documentation is inconsistent, leading to audits being complicated by missing approvals or unclear records.

    Integration of MRB with NCR, CAPA, and Change Management

    MRB is part of the broader quality system, not a separate island. NCRs identify and document the condition. MRB decides the disposition. CAPA addresses why the issue happened and how to prevent recurrence.

    MRB teams contribute to aviation safety by maintaining structural integrity and preventing future failures through root cause analysis. Repeated material review cases may trigger supplier 8D, process changes, updated inspection plans, or engineering change notices. If the same deviation is discussed every monthly basis, the issue is no longer just an MRB workload problem. It is a system signal.

    Connect981 links NCR, MRB, CAPA, and change workflows so leaders can see whether corrective action reduces future risk.

    Digital MRB in Practice: Making Decisions Enforceable and Audit-Ready

    Disconnected data and documentation can slow down MRB processes, as many reviews still rely on spreadsheets or shared folders, leading to confusion about the most current information. Manual routing and follow-up can stall MRB processes, as reliance on people passing forms or forwarding emails can lead to delays if someone is unavailable.

    Digital MRB changes the control point. On-hold parts cannot be issued, installed, or shipped until an approved mrb decision is complete. Role-based access ensures only authorized board members approve dispositions. E-signatures, timestamps, and revision history create the audit trail.

    Limited visibility into patterns of nonconformance can hinder MRB effectiveness, as data scattered across drives makes it difficult to identify recurring issues before they escalate. Dashboards for open cases, scrap value, supplier trends, and cycle time help most manufacturers focus improvement work where it matters.

    An engineer is using a tablet while standing beside various aircraft parts in a maintenance bay, engaging in the material review board process to assess the quality of components. This setting highlights the collaboration of quality engineers and cross-functional teams in managing nonconforming materials and ensuring safety in aerospace operations.

    Examples of Nonconforming Materials and MRB Review Scenarios

    • Machined structural bracket: A hole is 0.020 inch out of tolerance. MRB teams analyze the damage to aircraft parts to understand its nature and extent, focusing on factors such as metal fatigue and stress loads. Stress may approve use as is with serial-specific traceability.
    • Composite panel: NDI finds local porosity or ply misalignment. If allowable limits and margins support repair, an approved scheme is issued. If not, scrap is required.
    • MRO corrosion finding: Corrosion on a wing skin panel is reviewed against OEM repair data and EASA expectations. The repair, inspections, and release records stay linked.
    • Supplier fastener issue: Oversize holes appear across lots. MRB may initially approve rework or repair, then escalate to CAPA when trend data shows recurring supplier risk.

    Best Practices for a Robust Aerospace MRB Process

    • Define written authority, escalation rules, disposition categories, and risk thresholds.
    • Use standardized digital templates for every review and attachment.
    • Train mrb engineers, quality assurance, and board members regularly on AS9100, customer rules, and lessons learned.
    • Keep independence clear. Safety and conformity outrank schedule pressure.
    • Track metrics such as weekly backlog, cycle time, scrap cost, and repeat defects.
    • Link outcomes to work instructions, supplier collaboration, and future process improvements.
    • Treat objective evidence as a best practice, not an audit afterthought.

    How Connect981 Helps Standardize and Scale MRB in Aerospace Organizations

    Connect981 is an aerospace operations platform that unifies NCRs, MRB decisions, CAPA, routing, supplier workflows, and work execution on top of existing ERP, MES, PLM, and QMS systems.

    Zero and low-code tools let quality and manufacturing engineers configure approvals, notifications, and templates without a long IT project. Digital work instructions execute rework and repair consistently, while results and signoffs are captured at the point of work.

    For teams modernizing mrb aerospace processes, the goal is practical: stronger disposition control, clearer decision authority, and audit-ready traceability. Request a Connect981 demo to see how your MRB workflow can be standardized across sites and suppliers.