RSC Topic: Machine Learning and Data Analytics

  • What is the difference between OEE and OAE?

    OEE (Overall Equipment Effectiveness) and OAE (Overall Asset Effectiveness) are related metrics, but they answer different questions and use different time bases. In practice, the difference is mostly about what time you include and how broadly you define the asset.

    What OEE measures

    OEE is usually defined for a specific piece of production equipment over scheduled production time. It combines three components:

    • Availability: Actual run time vs. scheduled production time (excluding planned shutdowns such as holidays or agreed maintenance windows).
    • Performance: Actual output speed vs. theoretical or standard speed while running.
    • Quality: Good units vs. total units produced (including scrap and rework).

    Conceptually, OEE asks: “Given the time we intended to run this machine, how effectively did it convert that scheduled time into good parts at the planned rate?” Planned stops outside the defined production window are typically not counted as a loss in OEE.

    What OAE measures

    OAE usually widens the lens in two ways:

    • Time base: Uses total calendar time (24/7 or another full-time definition) rather than only scheduled production time. Planned downtime such as maintenance, changeovers, meetings, or shift gaps is included in the denominator.
    • Scope: Often applied to a line, area, or asset group, not just a single machine, and may include non-manufacturing constraints such as material availability or staffing as part of effectiveness.

    Conceptually, OAE asks: “Given all the time this asset exists on the plant floor, how much of that time results in good output at the intended rate?” It treats more types of downtime (including many planned events) as potential opportunity loss.

    Key differences in practice

    • Denominator / time definition:
      • OEE: Denominator is scheduled production time. Time outside that window is ignored.
      • OAE: Denominator is total time (commonly 24/7 or asset-available calendar), so more time categories count as loss.
    • Treatment of planned downtime:
      • OEE: Planned maintenance, holidays, and sometimes changeovers are usually excluded from the calculation window.
      • OAE: Many of these planned events are included as part of overall effectiveness, exposing opportunities such as shortening changeovers or optimizing maintenance.
    • Question being answered:
      • OEE: “How well do we run when we are supposed to be running?”
      • OAE: “How much of the asset’s total potential time actually produces good output?”
    • Granularity:
      • OEE: Commonly used at machine or cell level for focused improvement.
      • OAE: Often used at line, area, or plant level to expose structural constraints (staffing models, maintenance strategy, planning, and logistics).

    Why the distinction matters in regulated, brownfield environments

    In real plants with legacy MES/ERP, mixed vendors, and limited downtime, the choice between OEE and OAE affects both behavior and integration complexity.

    • Data sources and integration: OEE can sometimes be calculated mainly from machine states and production counts. OAE usually requires additional signals (planning, maintenance tickets, staffing, material status) from ERP, CMMS, and scheduling tools. Integration quality and time-model alignment across systems are often the limiting factors.
    • Time-model consistency: Regulated plants often maintain multiple, conflicting calendars (production schedule, maintenance windows, cleaning, validation holds). OAE forces you to reconcile these into a single time model. If that is not done carefully, OAE becomes noisy or misleading.
    • Behavioral impact: Focusing only on OEE can hide structural issues such as chronic under-scheduling or long planned changeovers. Focusing only on OAE can unfairly penalize necessary, mandated activities (cleaning, validation, calibrations) unless they are explicitly categorized and interpreted correctly.
    • Validation and traceability: Any metric used in dashboards or reviews that influence batch disposition, capacity planning, or capital decisions should have traceable definitions, version-controlled calculation logic, and documented data lineage. Moving from OEE to OAE typically changes the denominator definition and classification logic, which must go through change control in regulated environments.

    Common pitfalls and tradeoffs

    • Inconsistent definitions across sites or vendors: Different MES, historians, and OEE packages often implement their own interpretations of “planned” vs. “unplanned” time. Before comparing OEE or OAE across assets or plants, you need a documented, harmonized standard.
    • Using OAE without maturity in time classification: If your event and downtime coding are weak or inconsistent, OAE will mix together regulatory requirements, planning decisions, and avoidable losses. This can drive unproductive debates unless you first improve data quality.
    • Over-optimizing for a single metric: Chasing OAE can create pressure to cut into required maintenance, cleaning, or training. Chasing OEE can encourage narrow local optimization that ignores material readiness, staffing, or upstream quality. Both metrics should be interpreted in the context of safety, compliance, and long-term asset health.
    • Full replacement of existing KPIs and systems: Attempting to rip out existing MES/OEE tools and standardize on a new OAE platform often collides with validation burden, qualification of new data flows, and downtime risk. It is usually more practical to layer OAE analytics on top of existing systems, reusing validated data and incrementally tightening time definitions.

    Which should you use?

    Most regulated plants benefit from using both, with clear roles:

    • Use OEE at equipment or line level to drive day-to-day loss elimination within the existing schedule.
    • Use OAE at asset, area, or plant level to challenge structural decisions such as shift patterns, maintenance strategy, and changeover design.

    In a brownfield context, the practical sequence is often:

    1. Stabilize and standardize OEE definitions and data capture across key assets.
    2. Align calendars and time-bucket definitions across MES, ERP, maintenance, and scheduling tools.
    3. Then introduce OAE on top of that foundation, with clear governance on how planned activities are classified and interpreted.

    The value of either metric depends less on the label and more on consistent definitions, reliable data, and disciplined change control as definitions evolve.

  • What machine learning methods work best for finding scrap drivers in MES data?

    Usually, tree-based methods work best first, not because they are universally superior, but because MES scrap data is typically messy, sparse, mixed-type, and full of interactions. In practice, gradient boosting, random forests, and decision trees are often the most useful starting point for finding likely scrap drivers.

    They tend to work better than more elegant-looking methods when you have a brownfield mix of operator inputs, machine states, routing history, rework loops, lot-level context, and missing values. They can capture non-linear relationships and interactions such as a scrap spike that only appears on a specific machine, part family, revision, shift, material lot, and setup sequence.

    What usually works in practice

    • Gradient boosting: Often the strongest baseline for predicting scrap risk or ranking contributing variables. It handles tabular manufacturing data well, but it still depends on clean feature engineering and careful validation.

    • Random forests: Useful when you want a robust, lower-maintenance model and a practical view of variable importance. They are often easier to stand up, though sometimes less precise than boosting.

    • Decision trees: Good for interpretable first-pass rules and operator-facing discussions, but standalone trees are usually less stable and less accurate.

    • Association rules and sequence analysis: Useful when scrap appears after certain event patterns, routing branches, holds, queue times, or setup sequences rather than from one variable alone.

    • Anomaly detection: Helpful when scrap labels are incomplete or delayed. This can identify unusual runs, machines, or parameter combinations, but it does not by itself explain whether the anomaly caused scrap.

    • Clustering: Useful for segmenting failure modes or separating different scrap patterns before supervised modeling. It is rarely enough on its own.

    • Logistic regression: Still valuable as a benchmark because it is transparent and easier to validate, especially where explainability matters. It may miss important interactions unless features are engineered carefully.

    What matters more than the algorithm

    For scrap-driver analysis, data structure usually matters more than model choice. MES data alone is often not enough. The strongest results usually come when MES is linked to quality records, genealogy, routing history, machine or PLC context, tool usage, maintenance events, operator actions, material lots, inspection outcomes, and engineering change history.

    If timestamps are misaligned, scrap is logged late, rework is blended with true scrap, or nonconformance codes are inconsistent, the model may confidently rank the wrong drivers. That is a common failure mode. The model can learn what was documented most consistently, not what actually caused the loss.

    Best method by objective

    • If the goal is prediction: Start with gradient boosting and compare it with logistic regression as a transparent baseline.

    • If the goal is interpretable driver discovery: Use tree-based models plus SHAP-style feature attribution or partial dependence analysis, then verify findings with process engineering and quality review.

    • If the goal is event-pattern discovery: Use sequence mining, time-window features, and association analysis.

    • If the goal is early warning with weak labels: Use anomaly detection, then connect anomalies back to NCR, scrap, and rework outcomes.

    Tradeoffs and constraints

    There is a tradeoff between accuracy and interpretability. More complex models may rank variables better but can be harder to defend in a regulated operation where traceability, validation, and change control matter. Simpler models are easier to review and sustain, but they may understate interaction effects that actually drive scrap.

    There is also a tradeoff between local usefulness and enterprise scale. A model that works on one line or part family may fail elsewhere because product mix, routing logic, inspection points, and operator behavior differ. Do not assume one plant-level scrap model generalizes across cells, sites, or programs.

    Class imbalance is another practical constraint. Scrap events are often relatively rare compared with good production, so models can look accurate while being operationally useless. Precision, recall, false positive burden, and actionability matter more than headline accuracy.

    Brownfield reality

    In most plants, the right approach is not replacing MES to do machine learning. Full replacement often fails because of qualification burden, validation cost, downtime risk, integration complexity, and the long lifecycle of existing equipment and connected systems. A more realistic path is to layer analytics on top of existing MES, ERP, QMS, historian, and machine data sources, then improve data mapping over time.

    That approach still has dependencies. If master data is inconsistent, event semantics differ by line, or scrap reason codes are not governed, the analytics layer will expose those weaknesses quickly. The model will not fix integration debt by itself.

    Practical recommendation

    Start with a narrow use case on one product family or process step. Build a supervised tabular model using tree-based methods, compare it with a transparent baseline, and validate outputs against known process knowledge, NCR history, and recent engineering changes. Treat the output as ranked hypotheses for root cause investigation, not as proof.

    If you cannot reliably connect scrap outcomes to the preceding material, machine, routing, setup, and inspection context, improve data readiness first. In many cases, better genealogy, reason-code discipline, and event alignment produce more value than moving from one algorithm to another.

  • Can process drift alerts automatically stop a machine in aerospace manufacturing?

    Yes, process drift alerts can automatically stop a machine, but only when the control architecture, machine interface, and operating procedures are designed for it.

    In practice, there is a big difference between:

    • a monitoring alert that notifies an operator or supervisor, and

    • an interlock or control action that commands the equipment to pause, hold, or stop.

    Many aerospace manufacturers use alerts for escalation first and reserve automatic stops for a narrower set of conditions. That is because a stop event has operational, quality, and maintenance consequences, and in some cases it can create as much risk as it prevents.

    What has to be true for auto-stop to work

    An automatic stop typically depends on several plant-specific factors:

    • The machine controller or PLC must support external stop, hold, or inhibit signals.

    • The alerting system must be integrated to OT systems reliably and with predictable timing.

    • The drift threshold must be well defined, stable, and tied to a controlled process response.

    • The event handling must be tested so the machine transitions to a known state without damaging the part, tool, fixture, or equipment.

    • The behavior must fit the site’s validation, change control, and electronic record practices.

    If any of those are weak, the safer choice is often operator acknowledgement, supervisory review, or a controlled hold at the next process boundary rather than an immediate hard stop.

    Why the answer is often “sometimes” rather than a simple yes

    In aerospace manufacturing, process drift is not a single condition. It may mean a dimensional trend, tool wear, torque deviation, temperature shift, cure profile drift, vibration change, or statistical movement outside an expected band. The right response depends on the process and failure mode.

    For example, an automatic stop may be reasonable when continued operation is likely to produce more nonconforming product quickly. It may be less appropriate when the signal quality is noisy, the drift model is not mature, or stopping mid-cycle could compromise the part or create recovery complexity.

    That is why experienced plants usually classify responses by severity:

    • informational alert only

    • operator acknowledgement required

    • controlled process hold at a defined checkpoint

    • automatic stop or inhibit under tightly defined conditions

    Key tradeoffs

    • False positives versus escape risk: Aggressive thresholds catch drift earlier but can create nuisance stops, lost throughput, and operator workarounds.

    • Speed versus evidence quality: A fast stop can limit additional defects, but only if the data, timestamps, and event context are trustworthy enough for root cause analysis and disposition.

    • Protection versus recoverability: Some processes can restart cleanly after a hold. Others cannot, especially where thermal cycles, cure windows, machining paths, or in-process setups are sensitive.

    • Local optimization versus system impact: Stopping one machine may protect quality but disrupt upstream and downstream routing, labor allocation, and due-date performance.

    Brownfield reality

    In many aerospace plants, the answer is limited less by analytics than by integration quality. A modern monitoring layer may detect drift, but the machine may be controlled by legacy PLCs, OEM interfaces, or isolated cells that were never designed for closed-loop intervention from MES, SCADA, or analytics tools.

    That coexistence matters. Full replacement of machine controls or execution systems often fails economically and operationally in regulated, long-lifecycle environments because of qualification burden, validation cost, downtime risk, integration complexity, and the fact that legacy assets may stay in service for years. As a result, many sites implement auto-stop selectively, cell by cell, rather than as a plant-wide default.

    What to verify before enabling it

    • Whether the stop action is a safety-related function, an operational hold, or a quality interlock

    • How the event is recorded for traceability, review, and investigation

    • Who can override, reset, or re-enable the machine, and under what change-controlled rules

    • Whether the alert logic has been tuned using actual process history rather than theoretical limits alone

    • How the process behaves during communication loss, sensor failure, bad data, or partial integration failure

    A common failure mode is assuming the analytics are the hard part. Often the harder part is dependable machine-state orchestration, exception handling, and disciplined governance around threshold changes and override behavior.

    So the short answer is yes, but only when the machine, controls, integration, and process governance support it. In aerospace manufacturing, automatic stops should usually be targeted to specific high-risk conditions, not treated as a universal default for every drift alert.

  • Manufacturing Data Historian: From Time‑Series Storage to Connected Aerospace Operations

    Manufacturing Data Historian: From Time‑Series Storage to Connected Aerospace Operations

    Most aerospace factories do not lack data. They lack a reliable way to connect machine evidence to work orders, serial numbers, quality decisions, supplier records, and audit history.

    A manufacturing data historian solves the first part of that problem: capturing what happened in the plant, when it happened, and under what process conditions. The larger operational challenge is making that historian data usable by the teams making daily production, maintenance, and compliance decisions.

    Answering the Core Question: What Is a Manufacturing Data Historian?

    A manufacturing data historian is specialized software for capturing, storing, and retrieving timestamped time series data from industrial equipment, PLCs, sensors, test stands, process controls, and industrial control systems. Data historian software is specifically designed to capture, store, and manage vast quantities of time-series data generated by industrial processes, providing real-time visibility into operations and a centralized repository for operational data.

    Historians emerged in the late 1980s and early 1990s to manage continuous data generated by SCADA, PLCs, and distributed control systems in chemicals, oil and gas, power, and process manufacturing. In aerospace, historian software often sits behind autoclaves, ovens, CNCs, shot peen machines, plating lines, environmental chambers, and engine test cells.

    The key purposes are real time visibility, historical data review, traceability, predictive maintenance, and quality analysis. Data historians enable real-time monitoring and historical trend analysis, which are essential for optimizing industrial processes and ensuring compliance with regulatory standards. The historian is necessary, but not sufficient. Its value rises when connected to work orders, quality checks, supplier collaboration, and compliance workflows.

    How Manufacturing Data Historians Work Day to Day

    Data historians allow continuous data collection from diverse factory equipment. They collect data from PLCs, CNC controllers, SCADA systems, DCS, IoT gateways, and condition monitoring systems using OPC UA, Modbus TCP, EtherNet/IP, ProfiNet, and vendor drivers.

    Each tag represents data points such as spindle speed, torque, temperature, pressure, flow, vibration, current draw, line speed, alarms, or analog data. Sampling may occur every few milliseconds, every second, or every few minutes. This high speed data collection gives process engineers reliable data for data analysis, troubleshooting, and process optimization.

    Timestamps matter. Data historians allow engineers to replay past events millisecond by millisecond to diagnose machine failures. That precision helps isolate the exact root cause of quality defects, especially when a defect depends on the sequence of pressure, temperature, tool motion, or operator action.

    Historians use data compression and interpolation to store time series data efficiently, balancing high resolution data, long term data storage, and cost. Recent plant data may stay at full resolution; older plant operating data may be rolled up to min, average, and max values while preserving data integrity.

    In composite production, an autoclave may write temperature, vacuum, and pressure curves every second for each batch and part serial number. Those process variables become part of the evidence package for production quality and maintaining compliance.
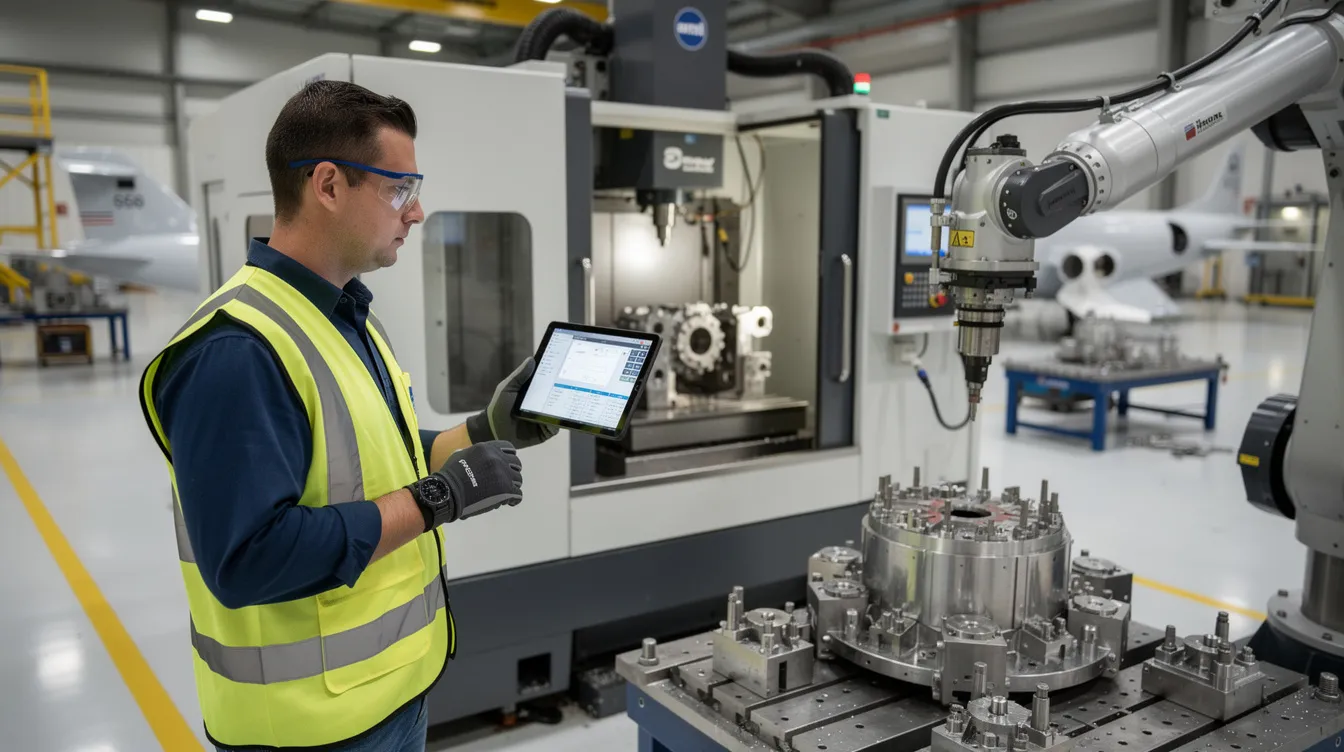
    A technician is examining aerospace manufacturing equipment on a factory floor, utilizing data historian software to collect and analyze operational data. This process allows for the continuous monitoring of equipment performance, helping to optimize operations and reduce downtime and maintenance costs.

    Data Historians vs Time‑Series Databases, SCADA, MES, ERP, and Data Lakes

    Data historian software is OT-centric data management software. It is built for stable ingestion, deterministic retrieval, data exchange with control systems, efficient storage, and data integrity in industrial settings. Unlike traditional databases and relational databases, data historians are optimized for high-speed data ingestion and retrieval, making them essential for predictive maintenance, historical trend analysis, and process optimization.

    Generic time-series databases often prioritize scale, developer APIs, and flexible queries across IoT, finance, or web metrics. They may not include native PLC, SCADA, or industrial control systems connectivity.

    SCADA provides operator screens, alarms, and real time data for control. The historian is usually the long-term memory behind SCADA.

    MES manages routing, execution, WIP, and electronic records. ERP, or enterprise resource planning, manages orders, inventory, finance, and resource allocation. Data historians integrate with manufacturing execution systems, enterprise resource planning software, and industrial control systems to centralize operational data, improve visibility, and facilitate data-driven decision-making. Data lakes aggregate historian exports, ERP, MES, QMS, supplier feeds, documents, and logs for advanced analytics tools used by data scientists and corporate users.

    In practice, the historian is one node in the architecture. Value comes from how historian data feeds MES, advanced analytics, and operational platforms such as Connect 981.

    What Types of Data Do Manufacturing Data Historians Capture?

    Data generated by historians typically includes:

    • Process data: temperature, pressure, flow, vacuum, humidity, cure profiles, paint booth conditions, and heat treat curves.
    • Machine performance: run, idle, fault states, cycle time, part counts, OEE signals, and production output.
    • Quality signals: torque curves, weld current, voltage, leak test results, vibration signatures, and test stand outputs.
    • Energy consumption: electricity, compressed air, gas, chilled water, and utilities by cell or program.
    • Event data: trips, interlocks, safety triggers, setpoint changes, operator actions, and alarms.
    • Facility conditions: cleanroom differentials, particle counts, storage temperature, humidity, and MRO bay conditions.

    The data collected by historians includes critical operational metrics such as temperature, pressure, and flow rates, which are timestamped for precise historical context, allowing for deep operational insights. Historians capture what happened and when. They usually need integration to show for which work order, serial number, repair order, or supplier lot.

    Why Data Historians Matter in Aerospace and Complex Manufacturing

    Aerospace operations depend on traceability, costly assets, and short response times. Data historians provide critical plant performance data for visualization and analytics tools, allowing manufacturers to spot bottlenecks and reduce waste.

    They continuously monitor key parameters such as machine performance, energy consumption, and production output, allowing manufacturers to fine-tune operations and detect inefficiencies before they escalate. By leveraging data historian software, manufacturers gain deeper visibility into their processes, helping them to optimize performance and drive continuous improvement.

    Data historians preserve years of historical records required for strict regulatory and safety compliance. Historians provide immutable, long-term data trails that allow manufacturers in highly regulated industries to prove compliance and achieve end-to-end product traceability. Standards such as EN 9130:2020 reinforce the need for retrievable aerospace records.

    For maintenance, data historians support predictive maintenance by continuously analyzing equipment performance and identifying early warning signs of potential failures, which helps in scheduling maintenance proactively and preventing costly unplanned outages. Predictive maintenance strategies enabled by data historians can lead to significant reductions in maintenance costs by replacing reactive repairs with planned interventions based on data-driven insights.

    From Raw Signals to Context: Events, Batch Records, and Operational Meaning

    Raw data is not enough. Event frames, batches, or unit procedures transform raw data and sequential measurements into production runs, test sequences, cure cycles, or repair events.

    Data historians create complete genealogy records for every batch to simplify compliance with automated audit trails when historian events are linked to material lots, serial numbers, operator IDs, tooling, program revision, and inspection records. A practical aerospace example is linking an autoclave cure curve to a composite panel serial number and its AS9102 first article inspection record.

    Historian vendors often provide event tools, but full operational process data usually requires MES, PLM, ERP, QMS, or workflow integration.

    Data Integrity, Advanced Data Storage, and Long‑Term Retention

    Data integrity and advanced data storage matter because aerospace audits often ask for proof long after the work was performed. A customer may request a 10-year-old pressure curve and expect it within minutes, complete and unaltered.

    Key features include checksums, write-once history blocks, redundant collectors, store-and-forward buffering, clock synchronization, restricted write access, strong authentication, and tamper-evident archives. Advanced data storage may use hot solid-state storage, warm disks, cold cloud object storage, archiving rules, and compression policies.

    Remote test stands may backfill late data after a network outage. Good historians preserve original timestamps and reconcile the upload without corrupting performance trends.

    Dashboards, Analytics, and Predictive Maintenance Built on Historian Data

    Historians are a primary source for dashboards, key performance indicators, downtime paretos, SPC charts, energy graphs, and condition monitoring panels. Engineers often retrieve data into BI tools, Excel, or notebooks to identify trends.

    Predictive maintenance models use equipment performance history to detect early warning signs of potential equipment failures. Teams can schedule maintenance proactively, reduce downtime and maintenance costs, extend asset life, and validate repairs.

    By leveraging historical data trends, manufacturers can adjust production schedules and maintenance plans to reduce energy usage and minimize waste, ultimately enhancing operational efficiency. The constraint is that insight often stays in dashboards unless it is pushed back into daily work.
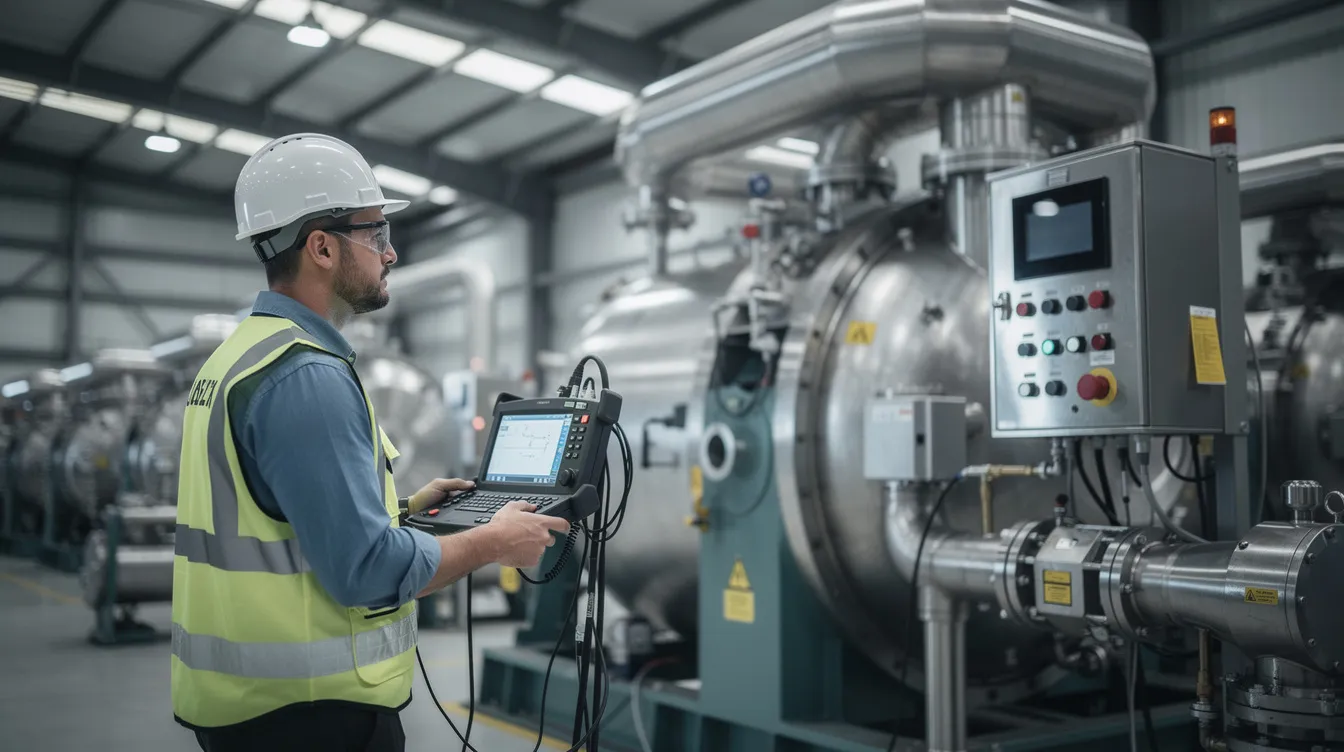
    An engineer is inspecting a large industrial machine using diagnostic equipment to collect data on its performance, aiming to optimize operations and identify potential equipment failures. This process involves analyzing operational data and historical data to ensure efficient and reliable industrial operations.

    The Hidden Problem: Data Silos Around the Historian

    Data historians help prevent data silos by providing a centralized repository for operational data, enabling effective management and utilization across different departments. They also eliminate manual, error-prone paper logs by unifying siloed data from different machine brands.

    Still, many aerospace plants have multiple sites, multiple historians, OEM mini-historians, spreadsheets, ERP records, supplier certificates, QMS records, and maintenance files. Data silos return when historian data is separated from routing, nonconformance, inspection, and supplier evidence.

    The result is familiar: engineers export CSVs, compare timestamps manually, search screenshots, and reconstruct a story days after a defect. That weakens data driven decision making and slows informed decisions.

    Where Connect 981 Fits: Turning Historian Data into Operational Workflows

    Connect 981 is not a data historian, SCADA replacement, or time-series database. It is a unified operational layer for aerospace manufacturing and MRO that uses historian data inside work instructions, work orders, quality checks, supplier coordination, and audit-ready records.

    In a typical architecture, the historian continues to collect high-resolution industrial data. Connect 981 connects that historian data to ERP, MES, PLM, QMS, supplier systems, and shopfloor execution.

    If furnace tags show repeated temperature drift, Connect 981 can trigger a maintenance task, hold affected work orders, require additional inspection, and capture the decision trail. A test cell speed and torque curve can appear inside a digital work order or nonconformance record, so quality teams see context rather than separate tools.

    Connect 981 also supports AI-assisted root cause analysis, combining historian trends with defect logs, supplier lots, routing changes, and shift data.

    Connecting Historians with Work Orders, Quality, and Traceability

    In production execution, historian tags tied to operations let supervisors see live conditions and past deviations before releasing work, scheduling rework, or changing priorities.

    In quality and compliance, automatic association of historian traces with serial numbers, batch records, inspection plans, and nonconformance records simplifies AS9100 and customer investigations.

    In MRO, test cell curves and condition data can be embedded in digital repair records to justify work scopes, component replacements, and warranty positions.

    In supplier visibility, heat treat profiles, special process curves, and supplier historian evidence can be surfaced through Connect 981 during incoming inspection and approval workflows. The benefit is fewer spreadsheets, fewer screenshots, and a stronger digital thread.
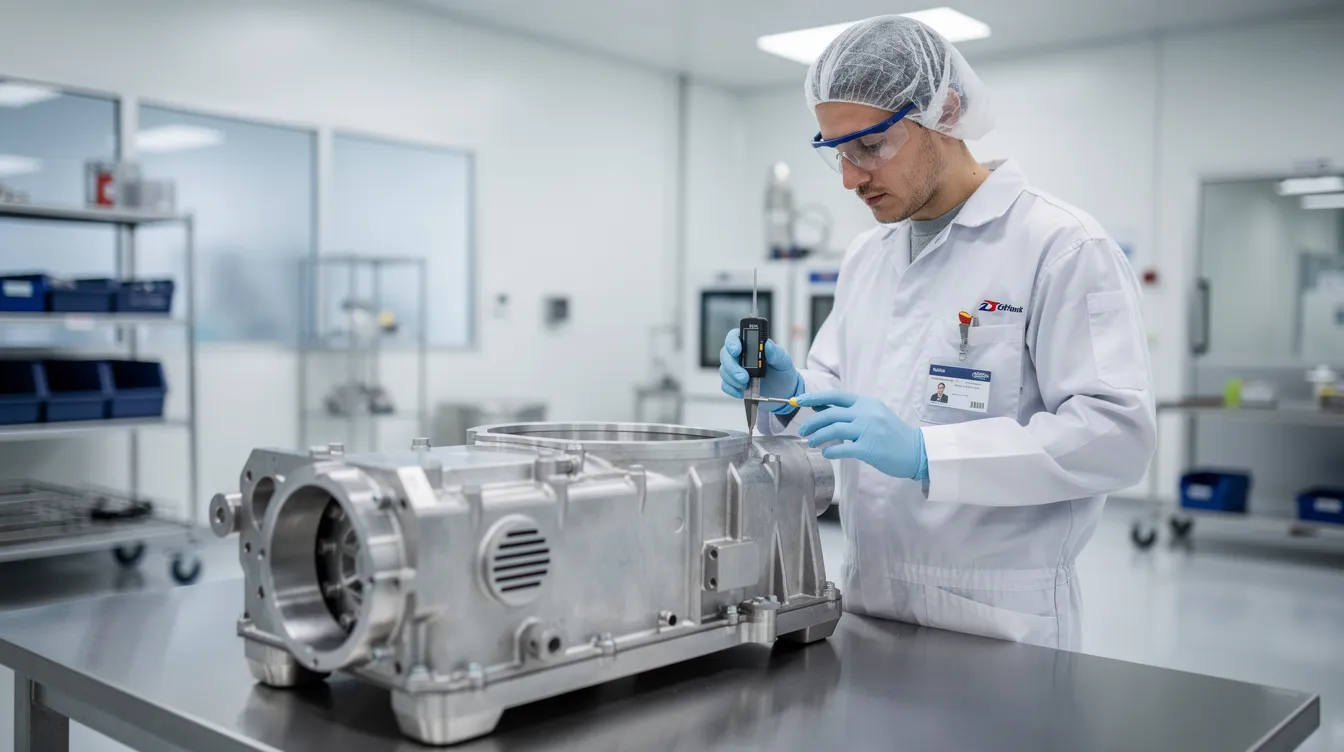
    A technician is inspecting an aerospace component in a clean manufacturing area, ensuring the equipment meets high standards for quality. This process is crucial for collecting reliable data and optimizing operations within industrial settings, where maintaining compliance and analyzing operational performance is key to reducing downtime and maintenance costs.

    Implementation Risks and Modernization Considerations

    Modernization fails when teams underestimate integration. Legacy PLCs, older SCADA, isolated test stands, network segmentation, and proprietary files often require gateways and careful OT coordination.

    Scalability matters. Size historian platforms for future sensors, multiple sites, higher tag counts, and longer retention, not only current loads.

    Governance matters too. Define tag naming, units, access rights, retention policies, ownership, and change control. Without data management discipline, even reliable historians become difficult to trust.

    Change management is equally important. A new cloud-ready historian does not guarantee adoption. Plant teams need simple ways to consume the data in daily decisions.

    A practical path is incremental: connect high-value assets first, keep mission-critical historians stable, add workflow integration above them, and apply least-privilege cybersecurity controls.

    Decision Framework: What Do You Need from Your Historian vs Your Operational Layer?

    For the historian, confirm these essentials: reliable high-frequency data collection, robust timestamps, compression controls, retention rules, data integrity, and integration with PLCs, SCADA, and DCS.

    Ask: What sampling rates are required? How many tags? How many years online? Which records support aerospace, defense, FAA, EASA, or customer retention? Which tags require raw fidelity?

    For analytics and data lakes, decide where large-scale data analysis, AI/ML, cross-site benchmarking, and corporate reporting belong.

    For the operational layer, define where historian data must drive action: work instructions, nonconformance workflows, maintenance tasks, supplier records, production review, and audit documentation. Do not overload the historian with workflow responsibilities it was never designed to handle.

    Getting Started: Using Existing Historian Data to Improve Operations with Connect 981

    Start with one high-impact area: an autoclave, engine test cell, critical machining center, or special process where delays and escapes are expensive.

    Identify relevant tags, map them to work orders and serial numbers, define events that should trigger alerts, holds, maintenance actions, or extra inspections, then configure those workflows in Connect 981.

    Connect 981 can sit alongside existing MES and ERP systems while respecting IT and OT security policies. Operations, quality, maintenance, and supply chain teams can work from the same connected evidence instead of offline reports.

    To see how current historian data can drive execution, production quality, supplier visibility, and audit-ready workflows across factories and repair sites, request a demo of the Connect 981 platform.

  • Spurious correlation

    Spurious correlation commonly refers to an apparent relationship between two variables that looks statistically meaningful but does not reflect a true underlying connection. The pattern may appear in charts, reports, or analytics outputs even when one variable does not meaningfully influence the other.

    In manufacturing and industrial operations, spurious correlation can appear when teams compare process, quality, maintenance, or production data and find a pattern that is coincidental, indirect, or caused by an unobserved third factor. For example, a plant may see a correlation between operator shift and defect rate, but the real driver could be product mix, machine condition, inspection timing, or missing data.

    A spurious correlation is not the same as proven causation. It also does not automatically mean the data is wrong. It means the observed association may be misleading if used without validation, domain context, or control for confounding factors.

    How it shows up in operations and systems

    • BI dashboards showing two KPIs moving together over time

    • MES, ERP, or historian data merged without enough context about timing, routing, or lot structure

    • Quality investigations that rely on trend matching alone

    • Predictive analytics or machine learning models that select variables with statistical signal but low operational meaning

    Common causes include small sample sizes, seasonal patterns, shared time trends, poor data alignment, hidden variables, and repeated slicing of data until a pattern appears.

    Common confusion

    Spurious correlation is often confused with correlation in general. Correlation only describes that variables move together; it does not explain why. It is also different from a root cause. A root cause is a validated explanation for an observed effect, while a spurious correlation is an association that may not hold up under deeper analysis.

    It can also be confused with confounding. Confounding is one common reason a correlation becomes spurious, but the terms are not identical. Confounding refers specifically to a third factor that distorts the observed relationship.

    Why the term matters

    In regulated and quality-sensitive environments, decisions based on spurious correlation can distort investigations, escalation priorities, process adjustments, and reporting. The term is commonly used as a caution in analytics, continuous improvement, and performance monitoring to distinguish observed signal from validated operational cause.

  • How does Connect 981 enable real-time visibility and AI-assisted pattern detection for aerospace scrap reduction?

    Connect 981 enables real-time visibility and AI-assisted pattern detection for aerospace scrap reduction by aggregating production and quality data, normalizing it against the process context, and then applying models to highlight statistically meaningful patterns in near real time. It does not replace MES, ERP, QMS, or machine controls; it sits alongside them and makes their data easier to use for scrap prevention.

    Real-time visibility: what Connect 981 actually does

    In an aerospace environment, scrap rarely comes from a single source system. Connect 981 focuses on stitching together data that is usually siloed:

    • Machine and process data (e.g., CNC, special process equipment, test stands) via OPC UA, MTConnect, or vendor APIs, where available.
    • Work order, part, and operation context from MES / ERP (e.g., routing step, revision, configuration, customer program).
    • Quality records such as nonconformances, inspection results, and rework records from QMS / MES.
    • Operator inputs (shift logs, defect categorization, notes) from lightweight shop-floor interfaces.

    Once connected and validated, Connect 981 can provide near real-time views such as:

    • Scrap and rework by part, operation, asset, shift, and supplier, updated as new data arrives.
    • In-process WIP at risk, using live defect and condition indicators rather than waiting for end-of-line inspection.
    • Heat maps of where scrap is emerging across lines, cells, and programs, with drill-down to specific work orders and assets.

    The practicality and latency of this “real time” view depend on integration choices, network design, and how frequently each source system publishes data. In some plants this will be seconds, in others it may be minutes or batched hourly.

    AI-assisted pattern detection for scrap drivers

    Connect 981’s AI capabilities are used to detect patterns that correlate with scrap and rework, not to automatically change process parameters or make pass/fail decisions. Typical use cases include:

    • Recurring defect pattern detection: Identifying combinations of part, revision, tool, operator, and machine state that precede specific defect codes.
    • Drift and stability monitoring: Flagging when process metrics (cycle time, torque, temperature, vibration, test margins) drift outside learned stable ranges that historically preceded low scrap performance.
    • Shift, program, and supplier comparisons: Highlighting statistically significant differences in scrap rates across shifts, crews, programs, or incoming material lots.
    • Sequence and routing effects: Detecting when certain operation sequences, setups, or rework paths increase the probability of final scrap.

    These capabilities typically rely on:

    • Historical datasets that include both process conditions and labeled scrap / rework outcomes.
    • Feature engineering aligned with the actual manufacturing context (e.g., operation-level, not just overall job-level data).
    • Model validation and versioning under change control so that insights are reproducible and traceable.

    In regulated aerospace environments, models should be used as decision-support tools. Human experts typically retain responsibility for root cause analysis, corrective actions, and any process changes.

    How this coexists with MES, ERP, QMS, and machine controls

    Connect 981 is designed for brownfield environments. It does not require replacing existing MES / ERP / QMS systems, which is often impractical in aerospace due to validation burden, audit history, and qualification of existing processes.

    Instead, Connect 981 usually:

    • Reads from MES / ERP for work order, routing, and configuration context.
    • Reads from QMS for nonconformance, defect, and CAPA linkages.
    • Reads from machine or cell controllers for operational and condition data.
    • Writes back limited information (e.g., risk tags, prioritized investigations, or summarized metrics) only where integration and governance allow it.

    This coexistence approach avoids the downtime, requalification, and migration risk of a full system replacement, but it does mean that data quality and modeling performance are constrained by whatever is available from existing systems and interfaces.

    Role in aerospace scrap reduction

    Connect 981 supports aerospace scrap reduction by making it easier to see and act on leading indicators of scrap:

    • Surfacing early warning signals that a cell, asset, or routing is starting to produce more defects than baseline.
    • Prioritizing where engineers and quality teams should focus limited problem-solving capacity.
    • Providing evidence to support 5-why and other root cause analysis tools with cross-system data rather than anecdotes.
    • Highlighting process and configuration variants that consistently yield lower scrap so they can be standardized where appropriate.

    Actual scrap reduction depends on follow-through: disciplined problem solving, validated process changes, and sustained change control. Connect 981 can help identify patterns and opportunities, but it does not itself implement corrective actions or guarantee performance improvements.

    Constraints, dependencies, and failure modes

    Connect 981’s impact on scrap reduction is limited by several common factors:

    • Data completeness and granularity: If defect codes, process parameters, or routing details are sparse, inconsistent, or recorded only as free text, AI models may produce weak or misleading signals.
    • Traceability gaps: Incomplete part-to-lot-to-operation traceability can prevent Connect 981 from linking specific process conditions to specific scrap events.
    • Integration limitations: Legacy equipment, brittle custom integrations, or restricted access to MES / ERP data can restrict near real-time visibility and force reliance on batch updates.
    • Model misunderstanding: If teams treat model outputs as causal proof rather than correlation, they may pursue the wrong corrective actions. Governance and expert review are essential.
    • Change control friction: In organizations with heavy qualification requirements, even clearly indicated improvements may be slow to implement, which limits realized scrap reduction.

    These are not specific to Connect 981; they reflect the normal realities of aerospace manufacturing with long-lived equipment and validated processes. Any AI-assisted scrap reduction approach will face similar constraints.

    Validation, traceability, and regulated use

    For regulated aerospace operations, Connect 981 should be treated as part of the validated toolset where its outputs materially influence quality decisions. Typical considerations include:

    • Documenting data sources, transformations, and model versions used in analyses.
    • Establishing procedures for reviewing and approving model-driven insights before they inform process changes.
    • Maintaining audit trails of who acknowledged alerts, what actions were taken, and which evidence supported decisions.
    • Ensuring that any claims about performance improvement are backed by controlled, time-bounded comparisons and not just anecdotal reports.

    Connect 981 can help assemble the evidence used in root cause analysis, CAPA, and continuous improvement work, but it does not itself confer any certification or guarantee successful audits.