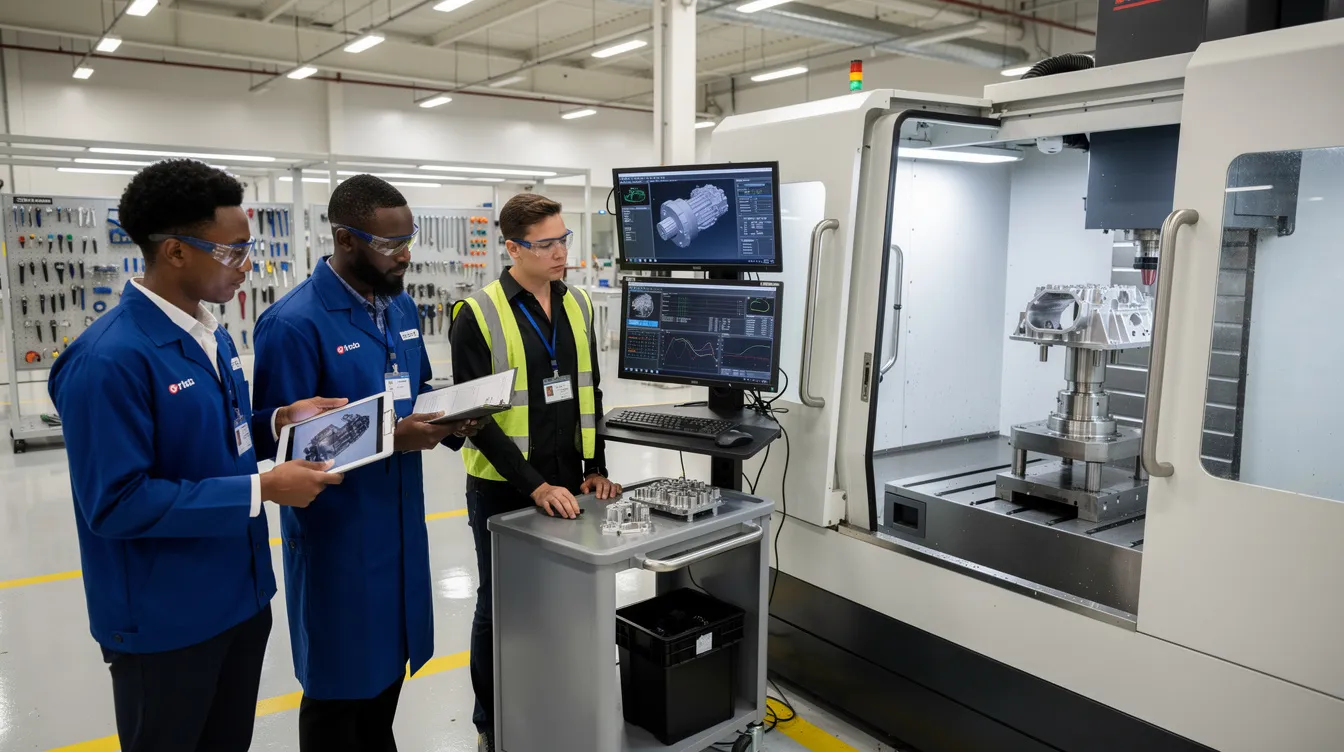
RSC Cluster: Data Mapping and System Interoperability

The Data Mapping and System Interoperability Cluster ties execution, planning, quality, and supplier systems together without rip-and-replace projects. It explains how governed data mapping enables interoperability across ERP, MES, QMS, PLM, and external partners. The content positions execution as the truth layer that systems align around. This cluster is the connective tissue of the entire ecosystem.

  • How does the MES system work?

    A Manufacturing Execution System (MES) works as the operational layer between business systems (ERP, PLM, sometimes APS) and the actual production assets and people on the shop floor. It turns high-level plans into executable, traceable work and captures detailed production history as that work is performed.

    Core idea: orchestrate and record production

    At a high level, an MES does four things:

    • Receives plans and definitions from ERP, PLM, and scheduling systems (orders, BOMs, routings, revisions).
    • Creates and manages work as operations and tasks that operators, cells, and machines execute.
    • Enforces rules and sequence so work follows approved process steps and data is captured at the right time.
    • Collects and stores production data (who did what, when, on which resource, with which materials, and what results).

    How well this works in practice depends on integrations, master data quality, configuration choices, and formal validation in regulated environments.

    Key functional building blocks

    Most MES platforms expose similar functional areas, even if naming differs by vendor:

    • Order and work management: Breaks down production orders into work orders / operations, assigns them to lines, cells, or work centers, and tracks their status. Often synchronized with ERP, which remains the system of record for customer orders and inventory.
    • Routing and workflow control: Represents the process flow (steps, resources, inspections, hold points). The MES checks that each unit, lot, or batch follows its approved route and blocks out-of-sequence or unapproved steps where configured.
    • Electronic work instructions: Presents the right instructions and reference data at the right step, linked to the correct product and revision. In regulated environments this usually needs tight document control, versioning, and evidence that the right version was used.
    • Data collection and traceability: Captures process parameters, inspection results, operator entries, machine data, and material usage. This is what supports genealogy, device history records (where applicable), and root cause analysis.
    • Resource and personnel management: Tracks equipment availability and, in some cases, operator qualifications or training status before allowing work on certain operations (depending on configuration and integrations with HR/LMS/QMS).
    • Nonconformance and exceptions: Records defects, deviations, holds, and rework routing. In many regulated plants, formal CAPA remains in the QMS while MES provides the shop-floor trigger and execution data.
    • Performance and WIP visibility: Provides near real-time views of work-in-process, cycle times, bottlenecks, and sometimes computes OEE or similar metrics, depending on how deeply it is integrated with machines and downtime tracking.

    How MES sits in your overall stack

    In a brownfield, regulated environment, MES is rarely a standalone solution; it has to coexist with a mix of legacy and modern systems:

    • ERP: Typically remains the source of truth for orders, inventory, costing, and financial postings. MES receives production orders and reports back completions, scrap, and sometimes labor time and material consumption.
    • PLM / PDM: Defines product structures, routings, and approved design/production data. MES usually consumes released artifacts (BOM, routing, specs, instruction content), not the in-development versions.
    • QMS: Owns formal nonconformances, CAPA, change control, and training records. MES often handles shop-floor data capture and execution steps that then feed or link to QMS records.
    • SCADA / PLC / machine controllers: Provide real-time process data and state. In some plants MES receives high-level signals (start/stop, counters); in others, it is closely coupled to SCADA or an IIoT platform to collect detailed parameters.
    • Data historians and IIoT platforms: May store high-frequency process data, with MES referencing or sampling that data for traceability and analytics.

    The actual data flows are highly implementation-specific. For example, some sites send all material movements through ERP and use MES only as the operational front-end; others make MES the operational system of record for WIP and synchronize to ERP at key handoff points.

    Typical MES process flow during production

    A simplified, generic flow looks like this:

    1. Order release: ERP (or a planning system) releases a production order. MES imports it, associates it with the approved routing, and creates operations to be executed.
    2. Scheduling and dispatching: MES (or a separate scheduling system) sequences work and assigns operations to lines or cells, generating an operator-friendly dispatch list.
    3. Setup and verification: Before work starts, MES may enforce checks such as material availability, tool/equipment readiness, calibration status, and revision alignment of instructions and programs (where integrated).
    4. Execution and data capture: Operators log in to the MES, start operations, record setups, scan materials, and enter process or inspection data. Where integrated, machine and test equipment data are pulled automatically.
    5. Nonconformances and rework: If defects or deviations are detected, MES records them and may initiate holds, alternate routings, or rework steps, often under QMS control and procedures.
    6. Completion and backflush: When operations are complete, MES closes them, reports good and scrap quantities, and triggers updates back to ERP and sometimes inventory or warehouse systems.
    7. Genealogy and reporting: All actions and results are stored for traceability, audits, and performance analysis.

    In regulated environments, change control around these flows is strict. Any modification to routing logic, data collection requirements, or interfaces may need risk assessment, validation, and documented approval.

    Dependencies and constraints that shape how MES actually works

    How an MES works in a specific plant is strongly shaped by constraints:

    • Integration quality: Weak or brittle integrations with ERP, PLM, and automation often lead to manual workarounds, dual data entry, and inconsistent records.
    • Master data maturity: Poorly maintained routings, BOMs, work centers, and revision control severely limit what MES can automate or enforce.
    • Validation and qualification: In aerospace, medical, and similar sectors, the effort to validate MES workflows and interfaces often means functionality is deployed incrementally and is slow to change.
    • Legacy equipment: Older machines and test stands may not be easily connected. MES may rely on manual entry or intermediate data collection tools, which increases risk of error and reduces real-time visibility.
    • Downtime and rollout constraints: Cutovers must avoid extended downtime. As a result, many plants run MES alongside older systems for an extended period, with phased migrations by product line or area.

    This is why full “rip-and-replace” MES strategies often stall in high-criticality environments: the qualification burden, integration complexity, and risk of disrupting validated flows push organizations toward staged adoption and coexistence with legacy tools.

    What MES does not do by itself

    It is also important to be clear about what MES does not automatically provide:

    • It does not guarantee compliance or audit outcomes. It can support traceability and procedural control, but outcomes depend on configuration, disciplined use, and overall quality system maturity.
    • It does not replace the need for QMS, PLM, or ERP. Some vendors blur boundaries, but in most regulated plants, MES works alongside these systems rather than fully displacing them.
    • It does not fix process design issues. MES can expose bottlenecks and enforce rules, but poorly designed or unstable processes still need engineering and quality work.

    Connecting this to brownfield deployments

    In a typical brownfield plant, the MES system works as a layer stitched into existing systems and procedures rather than a clean, end-to-end solution. Expect:

    • Selective use of MES functions in certain lines or product families while others remain on legacy travelers or spreadsheets.
    • Hybrid traceability, where some genealogy lives in MES and some in older databases or even paper archives.
    • Gradual tightening of integration and data collection as trust in the system grows and as validation cycles are completed.

    When planning or evaluating how MES will work in your environment, the critical questions are not only what the software can do, but how it will interact with your existing stack, your change control processes, and your tolerance for downtime and revalidation.

  • How can legacy aerospace plants be integrated into a modern digital manufacturing architecture?

    Integrating legacy aerospace plants into a modern digital manufacturing architecture is possible, but it is almost never a clean-slate or full replacement exercise. Most progress comes from carefully scoped integrations, operator-facing digitization, and a stable backbone that coexists with legacy equipment and systems.

    Start with use cases, not a target stack diagram

    Before picking technologies, define 3 to 5 concrete, auditable use cases that justify any integration work, for example:

    • Digital travelers and work instructions on critical lines with AS9102 / FAI impact
    • Closed-loop NC/NCR capture at the station and linkage to QMS and MRB workflows
    • Real-time status of work orders and constraints for scheduling and AOG risk reduction
    • Automated collection of as-built data and traceability for high-criticality parts

    Each use case should have clear boundaries, owners, required data sources/consumers, and validation expectations. This drives what needs to be integrated now versus what can stay manual.

    Assume coexistence with legacy MES/ERP/PLM/QMS

    In most aerospace plants, core systems cannot simply be replaced due to validation cost, program qualification links, and downtime risk. A modern architecture usually means:

    • Keeping existing ERP, PLM, QMS, and often some MES capabilities in place
    • Adding an execution and data layer (e.g., modern MES / digital traveler / work instruction system) close to the shopfloor
    • Building controlled, well-documented interfaces between this layer and your existing stack

    Plan for long-term dual-running and incremental decommissioning of legacy functions, not a big-bang cutover.

    Use a “thin integration layer” pattern

    Given mixed vendors and old interfaces, a thin integration layer is often more sustainable than many point-to-point links. Typical patterns:

    • Canonical data contracts for work orders, parts, revisions, NCs, and inspection results, even if underlying systems vary by plant.
    • API / message bus where possible, and file-based or database integration where necessary, with explicit monitoring and reconciliation.
    • Read-first, then write: start with non-invasive reads from legacy systems before introducing write-back or orchestration.
    • Isolation of OT networks from enterprise integrations, with controlled gateways that enforce cybersecurity and export control rules.

    Where equipment or software cannot be safely integrated online, consider offline data drops, operator scans, or post-shift upload as interim steps.

    Segment equipment by integration feasibility

    Not all assets in a legacy aerospace plant are worth the same integration effort. A practical segmentation is:

    • Tier 1: Natively connectable (modern CNCs, PLCs with Ethernet/IP or OPC UA, newer test stands). These can provide near real-time status and key process parameters.
    • Tier 2: Indirectly connectable (older PLCs, proprietary HMIs, equipment with serial links or basic data export). Often integrated via gateways, protocol converters, or extraction from existing SCADA.
    • Tier 3: Non-connectable / manual (very old equipment, manual benches, repair stations). Here, the integration point is the operator: digital work instructions, digital travelers, barcode/RFID scans, and simple forms to capture as-built and NC data.

    For each tier, explicitly decide the level of automation, validation impact, and expected benefit before investing in connectivity.

    Prioritize operator-facing digitization

    In brownfield aerospace plants, a high-ROI entry point is digitizing work instructions, travelers, and data capture at the station without initially changing the ERP/PLM/QMS stack. This can include:

    • Digital work instructions with revision-controlled content and approvals
    • Digital travelers routing operations with required inspections and signoffs
    • Structured capture of torque, dimensions, serials, lot numbers, and concessions
    • Station-level NC/NCR initiation linked back to the QMS or NCR system

    This approach builds the execution and traceability foundation that can later be integrated more deeply with planning and quality systems.

    Be explicit about validation, traceability, and change control

    Any change to digitally enabled processes, especially those touching AS9100, AS9102, or customer approvals, needs structured governance.

    • Treat new integrations and execution systems as GxP-style validated systems where applicable, with documented requirements, testing, and impact analysis.
    • Maintain configuration baselines for integrations, including mapping logic, field definitions, and transformation rules.
    • Ensure that as-built data and e-signatures remain traceable to specific software versions, device IDs, and configuration states.
    • Run parallel operations (paper plus digital or old plus new system) for a defined period on high-risk lines to prove equivalence before retiring legacy methods.

    Design the architecture so that audit evidence (who did what, according to which revision, and based on which inputs) can be reconstructed without reverse-engineering integrations each time.

    Align with cybersecurity, export controls, and data residency

    Modern architectures often introduce cloud or hosted components, which immediately raises CMMC, NIST 800-171/800-53, DFARS 7012, ITAR, and customer contractual questions. Practical considerations:

    • Keep controlled technical data flows documented: what data leaves the plant, in what format, to which system, and under which contractual and regulatory basis.
    • Use segmented OT networks and clearly defined gateways to prevent uncontrolled backdoors into legacy control systems.
    • Work with cybersecurity and export control teams early to avoid deploying architectures that will later be blocked or heavily constrained.
    • Where necessary, use Gov / GCC High / ITAR-appropriate environments instead of generic cloud hosting, accepting the cost and complexity tradeoffs.

    Failure to handle these constraints early can stall integration programs after significant sunk cost.

    Why full replacement strategies often fail

    In legacy aerospace plants, a plan to “rip and replace” all MES, SCADA, or planning systems with a single vendor platform usually fails or is scaled back because:

    • Qualification and validation for safety and airworthiness-critical programs are expensive and slow.
    • Downtime windows are narrow and often overcommitted to maintenance and line moves.
    • Custom integrations and tribal workarounds are poorly documented but mission-critical.
    • Programs run for decades, and customers may tie approvals to specific systems or processes.

    A more realistic approach is to stabilize the existing stack, introduce a modern execution and data layer around it, and then selectively retire legacy components where there is clear benefit and a manageable validation path.

    Practical roadmap structure for a legacy aerospace plant

    A pragmatic integration roadmap often looks like this:

    1. Baseline: Inventory equipment, systems, interfaces, and current data flows; assess cyber/export constraints and validation scope.
    2. Prioritize use cases: Select a small number of high-value, low-regret use cases for a pilot cell or line.
    3. Deploy a modern execution layer: Digital travelers, work instructions, and data capture at the pilot area, integrated minimally with ERP/QMS.
    4. Harden integrations: Introduce a simple integration layer (APIs, message bus, or controlled file exchanges) with monitoring and audit trails.
    5. Scale by pattern: Reuse proven patterns (data models, integration templates, validation approach) to additional lines, products, or plants.
    6. Selective decomposition: Gradually move functions away from fragile legacy applications once the new architecture is proven.

    At every stage, measure outcomes (e.g., fewer NCRs, improved on-time delivery, reduced traveler errors) and confirm that compliance and audit readiness are at least equivalent, if not improved.

    Key tradeoffs to make visible

    When integrating legacy aerospace plants into a modern digital architecture, decision-makers should explicitly weigh:

    • Speed vs. validation depth: Faster rollout with limited scope versus slower, fully validated end-to-end changes.
    • Automation vs. robustness: Highly automated data flows versus simpler operator-driven capture that may be easier to validate and troubleshoot.
    • Centralization vs. local autonomy: Single corporate architecture versus plant-specific adaptations that reflect legacy constraints.
    • Cost vs. lifecycle: Near-term integration spend versus long-term maintenance and obsolescence risk of bespoke solutions.

    Making these tradeoffs explicit, with clear ownership and documentation, is more important to long-term success than any specific tool choice.

  • How does a semantic model relate to our existing data warehouse schema?

    A semantic model is usually a business-facing layer that maps technical data structures into consistent, governed meanings. Your data warehouse schema is the physical and logical structure used to store, transform, and query data. They are related, but they are not the same thing.

    In practice, the warehouse schema answers questions like where data lives, how tables join, and how history is stored. The semantic model answers questions like what counts as a work order, which definition of yield is approved, how scrap is categorized, and which status values should be grouped together for reporting and analysis.

    So the short answer is this: a semantic model typically sits on top of, or references, the warehouse schema. It uses the schema as a source, then applies standardized business definitions, relationships, calculations, and naming so different teams are not each interpreting the same fields differently.

    What this means operationally

    • Your warehouse schema can remain largely intact while a semantic model is added above it.

    • The semantic model can hide some source complexity, but it cannot fix poor source data, broken integrations, or missing master data on its own.

    • Multiple schemas can feed one semantic model if you have separate MES, ERP, PLM, QMS, historian, or spreadsheet-driven data flows.

    • One warehouse can support multiple semantic models if different domains need different governed views.

    That distinction matters in regulated operations because the business meaning of data often needs tighter control than the storage design. A field in the warehouse may be technically valid while still being unsuitable for decision-making if its definition, lineage, or update rules are unclear.

    It is not automatically a replacement

    No, a semantic model is not usually a replacement for the warehouse schema.

    In brownfield environments, replacing the warehouse or forcing every source system into a new canonical structure is often more disruptive than useful. Plants commonly have mixed vendors, legacy customizations, qualified processes, and reporting dependencies that make full replacement expensive and risky. In regulated, long-lifecycle environments, those replacement programs often fail because of validation effort, downtime risk, integration complexity, and the burden of re-establishing traceability and change control across connected systems.

    A more realistic pattern is coexistence:

    • Keep the warehouse schema for storage, transformation, and historical persistence.

    • Add a semantic layer for governed definitions and cross-functional reporting.

    • Incrementally rationalize inconsistent terms, metrics, and relationships over time.

    Where the semantic model adds value

    The main benefit is not technical elegance. It is consistency.

    For example, operations, quality, and finance may all use the word scrap, but not mean the same thing. The warehouse may contain several relevant fields from MES transactions, ERP inventory movements, and NCR records. A semantic model can map those sources into an approved definition with documented logic, controlled calculations, and traceable lineage.

    This is especially useful when you need to:

    • standardize KPIs across sites or programs

    • align metrics across MES, ERP, PLM, and QMS data

    • reduce duplicate logic embedded in separate dashboards

    • support auditability of reporting definitions and changes

    • separate business meaning from vendor-specific field names and schema quirks

    Constraints and failure modes

    A semantic model helps only if governance is real. Common failure modes include:

    • different teams still keep local calculations outside the governed model

    • source systems use inconsistent codes, units, timestamps, or identifiers

    • master data is incomplete or not synchronized across systems

    • the semantic layer is treated as a reporting shortcut rather than a controlled business contract

    • changes to definitions are made without impact assessment, version control, or validation

    In other words, the semantic model can centralize meaning, but it does not remove the need for data stewardship, testing, and change control.

    How to think about the relationship

    A practical way to frame it is:

    • Warehouse schema: how data is stored and processed

    • Semantic model: what the data means for the business

    • Reports and analytics: how users consume that meaning

    If your current warehouse schema already encodes stable business definitions well, the semantic layer may be thin. If your environment has many source systems, local conventions, and metric disputes, the semantic layer becomes more important.

    The right design depends on your current architecture, data quality, governance maturity, reporting sprawl, and validation expectations. For many industrial organizations, the safest path is not warehouse replacement. It is a controlled semantic layer that brings consistency to existing data assets while preserving proven interfaces and minimizing disruption.

  • What integrations are required to connect MES into the digital thread?

    There is no universal integration checklist for connecting MES into the digital thread. At minimum, MES usually needs to exchange controlled execution data with the systems that define the product and process, plan the work, verify quality, manage exceptions, and retain evidence. Which integrations are truly required depends on what the digital thread must prove for a product, program, customer, and regulatory context.

    Common MES integrations in a digital thread

    The most common integrations are with systems that own upstream definitions, downstream records, or quality evidence. In regulated manufacturing, the important question is not just whether systems are connected, but whether the data is version-controlled, traceable, validated, and usable during an investigation or audit.

    • PLM or engineering document control: product structures, drawings, specifications, process plans, revision status, effectivity, and engineering changes.
    • ERP or MRP: work orders, demand signals, routings at a planning level, inventory, material allocations, completions, and cost or schedule status.
    • QMS: nonconformances, deviations, concessions, CAPA links, approvals, dispositions, and quality record references.
    • Inspection, metrology, or SPC systems: characteristics, measurement results, inspection status, sampling decisions, gage or equipment references, and evidence attachments.
    • CMMS, EAM, or calibration systems: asset status, maintenance holds, calibration validity, tool availability, and equipment constraints that affect execution.
    • Equipment, SCADA, PLC, or historian systems: machine state, process parameters, alarms, recipes, cycle data, and environmental data where those signals are relevant and reliable.
    • Warehouse, supplier, or receiving systems: lots, serials, certificates, incoming inspection status, kitting, and material genealogy.
    • Identity, training, and access control systems: operator authorization, role-based access, electronic signature support, and training prerequisites where required by procedure.
    • Data warehouse, lakehouse, or analytics platforms: curated read-only data for reporting and analysis, usually not as the system of record for regulated execution decisions.

    The integration scope should follow the traceability requirement

    MES does not need to integrate with every system to participate in a digital thread. It needs to integrate with the systems required to maintain a defensible chain from engineering definition to production execution, inspection evidence, material genealogy, and quality disposition.

    For some plants, ERP plus PLM plus QMS is the minimum practical set. For others, inspection equipment, calibration systems, or supplier data are equally important because the product risk, customer requirements, or process controls depend on them.

    Brownfield constraints matter

    In most established plants, MES is added to an existing mix of ERP, PLM, QMS, legacy databases, paper records, spreadsheets, machine interfaces, and custom middleware. Full replacement is usually unrealistic in regulated environments because of qualification burden, validation cost, downtime risk, integration complexity, traceability obligations, change control, and long equipment lifecycles.

    A more realistic approach is controlled coexistence: define the system of record for each data object, map identifiers and revisions, integrate only the data needed for execution and evidence, and phase the rollout by product line, work center, or value stream.

    Common failure modes

    The main failure mode is assuming that connectivity equals a digital thread. It does not. A brittle point-to-point interface can move data while still leaving unclear ownership, stale revisions, missing context, or incomplete audit trails.

    Typical problems include mismatched part numbers, ambiguous revision effectivity, duplicate routings, uncontrolled work instruction changes, missing lot or serial genealogy, incomplete exception handling, unvalidated middleware, weak time synchronization, and poor integration monitoring.

    Security and export control requirements can also limit what data may move, where it may be stored, and who may access it. Those constraints need to be designed into the integration architecture rather than added after go-live.

    What must be in place before integration works

    The prerequisites are usually master data discipline, clear system-of-record decisions, a canonical data model or mapping layer, documented interface requirements, change control, validation planning, error handling, and operational ownership. Without those controls, MES integrations often create faster data movement but weaker traceability.

    The practical answer is that MES integration into the digital thread is not a single interface project. It is a governed set of data relationships across engineering, planning, production, quality, maintenance, and records systems. The required integrations are the ones needed to preserve traceability and execution control for the specific operation.

  • Decision support system

    A decision support system is a computer-based system that helps people make decisions by organizing data, applying rules or models, and presenting outputs such as analyses, scenarios, alerts, or recommendations. It supports human judgment rather than replacing it.

    In industrial and manufacturing settings, a decision support system commonly brings together information from sources such as MES, ERP, quality systems, historians, maintenance systems, spreadsheets, or external supply data to help users assess conditions and choose among actions. Examples include systems that flag schedule risks, highlight quality trends, estimate the impact of a material shortage, or compare response options for a production deviation.

    What it includes

    • Data aggregation from one or more operational or business systems

    • Logic, rules, analytics, statistical methods, or simulation models

    • User-facing outputs such as dashboards, ranked options, exception alerts, or what-if analysis

    • Support for structured decisions, semi-structured decisions, or recurring operational reviews

    What it does not necessarily include

    A decision support system is not the same as a fully automated control system. It may recommend or prioritize actions, but the final decision is often made by a planner, supervisor, engineer, quality reviewer, or manager. It is also broader than a simple reporting tool, because it usually helps evaluate alternatives rather than only display past results.

    Operational meaning in manufacturing

    Operationally, a decision support system often appears as a layer above transaction and execution systems. It may read data from ERP, MES, QMS, EAM, or SCADA-related sources and help users answer questions such as:

    • Which work orders should be expedited based on due date, material status, and machine availability?

    • Which nonconformances show patterns that may require deeper investigation?

    • What is the likely production impact if a supplier shipment is delayed?

    • Which maintenance task should be prioritized based on risk, downtime history, and current asset condition?

    Some decision support systems are simple rule-based tools. Others use optimization, forecasting, machine learning, or simulation. The term does not require any specific technical method.

    Common confusion

    Decision support system vs. business intelligence: Business intelligence usually focuses on reporting, visualization, and trend analysis. A decision support system typically goes further by helping compare options, evaluate consequences, or recommend actions.

    Decision support system vs. expert system: An expert system usually tries to encode specialist knowledge to reach conclusions in a narrow domain. A decision support system is broader and may combine data analysis, models, and user input without trying to fully mimic expert reasoning.

    Decision support system vs. control system: A control system directly monitors and controls equipment or processes. A decision support system informs people or higher-level workflows and does not inherently perform direct real-time control.

  • What data should aerospace manufacturers collect for predictive quality models?

    Predictive quality models need more than defect counts. In aerospace, the minimum useful dataset usually combines product context, process history, inspection results, material genealogy, equipment state, and disposition outcomes at a level granular enough to tie a prediction back to a specific serial number, lot, operation, and revision.

    In practice, manufacturers should prioritize collecting data in six groups.

    • Product and configuration context: part number, serial or lot number, work order, operation sequence, assembly position, revision, effectivity, approved traveler or routing version, and any applicable process specification or inspection plan version.

    • Process execution data: timestamps, operation start and completion, machine program version, setpoints, actual process values, alarms, cycle times, holds, rework loops, queue time, environmental conditions where relevant, and whether work was performed in automatic, semi-automatic, or manual mode.

    • Inspection and metrology data: measured values, not only pass or fail flags. Include characteristic IDs, tolerance limits, gage or CMM identifier, sampling plan, measurement method, repeat inspection events, and MSA-related context if available. Models trained only on binary acceptance results often miss drift until it is too late.

    • Material and supply chain data: raw material heat or lot, supplier, cert linkage, shelf-life status where applicable, outside processing history, incoming inspection outcomes, substitutions, and as-built genealogy across subassemblies. For many aerospace quality problems, material lineage is more predictive than machine telemetry alone.

    • Equipment and tooling data: machine ID, tool ID, tool life or usage count, calibration status, maintenance events, offsets, fixture identity, software or firmware version where controlled, and downtime or fault history. This matters because apparent product variation can be caused by equipment state changes rather than operator execution.

    • Human and workflow context: operator or team identifier, certification or training status if governed and appropriate to use, shift, handoff events, digital work instruction version, deviation or concession references, NCR linkage, MRB outcomes, CAPA references, and scrap or rework disposition.

    The label set is equally important. If the goal is prediction, manufacturers need clear outcome definitions such as first-pass yield loss, dimensional nonconformance, downstream escape, rework occurrence, scrap, or supplier-related defect. Many projects fail because the plant has plenty of process data but weak, inconsistent, or delayed labels.

    What matters most

    The most valuable data is usually data that is:

    • Traceable: tied to the exact unit, lot, or assembly instance.

    • Time-aligned: able to show what happened before the defect or deviation was detected.

    • Revision-aware: linked to the correct drawing, process, program, and instruction versions.

    • Context-rich: able to distinguish normal variation from material, tooling, supplier, or configuration effects.

    • Reliable enough for use: consistent naming, units, timestamps, and event definitions across systems.

    Collecting more data is not automatically better. A smaller, governed dataset with strong genealogy and clean labels often outperforms a larger but inconsistent dataset.

    Common gaps that reduce model value

    In regulated aerospace environments, the limiting factor is often not the model. It is the data foundation. Common failure modes include:

    • inspection data stored as PDFs or images instead of structured values

    • MES, ERP, QMS, PLM, and metrology systems using different identifiers for the same part, operation, or supplier

    • missing links between rework, NCRs, concessions, and the original production event

    • tooling, fixture, and machine program versions not captured at execution time

    • operator-entered free text that cannot be normalized without substantial effort

    • limited historical depth after system migrations or paper-to-digital conversions

    • poor measurement system capability, which causes models to learn noise rather than process signals

    If these issues exist, collect the data anyway, but expect substantial work in data cleaning, event mapping, and validation before any model is production-relevant.

    Brownfield reality

    Most aerospace manufacturers do not have a single clean source of truth. Predictive quality usually has to coexist with legacy MES, ERP, PLM, QMS, lab systems, metrology software, spreadsheets, and supplier portals. That means the practical requirement is not just data collection, but durable identity mapping and event reconciliation across systems.

    For that reason, full replacement is often the wrong first move. In long-lifecycle, validated environments, rip-and-replace programs commonly stall because qualification burden, downtime risk, integration complexity, and change control overhead are high. A narrower approach is usually more realistic: start with one defect family, one product family, or one process step, then prove that the data lineage and outcome labeling are trustworthy.

    How to prioritize

    If resources are limited, start by collecting data that improves root-cause discrimination, not just dashboarding:

    1. unit or lot genealogy tied to operations and revision history

    2. structured measurement results for critical characteristics

    3. machine, tooling, and fixture identity at the time of execution

    4. material lot and supplier linkage

    5. NCR, rework, scrap, and downstream defect labels tied back to the originating step

    6. change events such as program updates, routing changes, or inspection-plan revisions

    That sequence usually produces more usable predictive signal than collecting generic IoT data with no reliable quality label.

    So the short answer is: collect the data that explains why a specific unit, lot, or operation produced a quality outcome, and make sure it is traceable across configuration, execution, measurement, material, equipment, and disposition. If that traceability is weak, predictive quality will remain limited no matter how sophisticated the model appears.

  • Incremental computation

    Incremental computation commonly refers to a way of processing data where a system updates only the parts of a result affected by new or changed inputs, rather than recomputing the entire result from scratch.

    In industrial software and manufacturing systems, this approach appears in analytics, event processing, scheduling, dashboards, genealogy views, exception monitoring, and integrations between MES, ERP, quality, or historian systems. For example, if one production record changes, an incremental process may update only the affected KPI, traceability chain, or report segment.

    The term includes methods that track dependencies, changed records, deltas, events, or state over time so that later runs can reuse prior work. It does not mean merely running a process more often. It also does not automatically imply real-time operation, although incremental methods are often used in near-real-time workflows.

    What it includes

    • Processing only new, changed, or invalidated data
    • Reusing prior results or intermediate state
    • Updating derived outputs such as counts, aggregates, alerts, or material status
    • Supporting repeated calculations in systems where source data changes continuously

    Common confusion

    Incremental computation is often confused with batch processing, caching, and incremental loading.

    • Batch processing refers to when work is run, not whether the logic recalculates everything or only changes.

    • Caching stores previously computed results for reuse, but incremental computation also manages how those results are selectively updated when inputs change.

    • Incremental loading moves only changed data between systems. Incremental computation uses changed data to update calculated outputs. A pipeline may use both, but they are not the same thing.

    Manufacturing context

    In regulated or traceability-heavy environments, incremental computation is commonly used to keep operational views current without reprocessing full production history each time. Typical examples include updating WIP status, recalculating OEE-related measures after a machine event, refreshing exception queues after a quality record change, or extending a lot genealogy graph when a new transaction is posted.

    Whether a system implements it through change data capture, event streams, dependency graphs, or application logic varies by platform and use case.

  • How does a semantic model support future AI and predictive analytics use cases?

    A semantic model supports future AI and predictive analytics by giving data from different systems a consistent business meaning. In practice, that means an analyst, application, or model can distinguish whether a field represents a work order, operation, serial number, nonconformance, asset state, material lot, inspection result, or routing step without reinterpreting each source system from scratch.

    That matters because most AI and predictive analytics efforts fail less from a lack of algorithms than from inconsistent definitions, poor context, and fragmented source data. A semantic model can reduce that problem by aligning records from MES, ERP, PLM, QMS, historians, CMMS, and edge systems into a usable structure.

    What it enables

    • Better feature quality for models. Predictive models need stable inputs. A semantic model can standardize concepts like cycle time, scrap event, downtime reason, revision, operator certification status, lot genealogy, or inspection outcome so the model is trained on comparable data.

    • Cross-system context. Many useful use cases depend on combining design, execution, quality, and maintenance context. For example, predicting scrap may require process parameters, material lineage, operation sequence, revision status, prior NCR history, and machine state. A semantic model helps link those records coherently.

    • Faster reuse across use cases. Once core entities and relationships are defined, teams can reuse them for dashboards, root cause analysis, copilots, anomaly detection, scheduling support, and forecasting instead of rebuilding mappings each time.

    • More traceable outputs. In regulated environments, model outputs are more useful when users can trace them back to source records, definitions, and transformation logic. A semantic model can support that lineage, but only if the implementation preserves source references and version history.

    • Cross-plant standardization with local variation. It can create a common layer across plants while still allowing site-specific differences in equipment, process flow, data granularity, or vendor schemas.

    What it does not do

    It does not automatically make data clean, complete, or prediction-ready. If source systems are missing timestamps, use inconsistent reason codes, have weak master data discipline, or lack reliable equipment-event correlation, the semantic model will expose those problems but will not solve them by itself.

    It also does not remove the need for validation, governance, and change control. If definitions change, routings are revised, or integrations drift over time, the semantic layer has to be maintained or the analytics built on top of it will degrade.

    Why this matters in brownfield environments

    In most plants, AI has to coexist with existing MES, ERP, PLM, QMS, historians, spreadsheets, and custom interfaces. A semantic model is often more realistic than a full platform replacement because it can sit across those systems and normalize meaning without forcing immediate rip-and-replace.

    That approach still has limits. If interfaces are unreliable, source identifiers do not match, or event timing is inconsistent across systems, model quality will suffer. In regulated, long-lifecycle environments, full replacement strategies often fail because of qualification burden, validation cost, downtime risk, integration complexity, and the need to preserve traceability and controlled change. A semantic model can reduce dependence on wholesale replacement, but it still requires disciplined integration work.

    Tradeoffs to expect

    • Upfront modeling effort versus downstream speed. Defining canonical entities, relationships, and business rules takes time, but usually reduces repeated data preparation later.

    • Standardization versus flexibility. If the model is too rigid, plants will work around it. If it is too loose, AI use cases lose consistency.

    • Governance versus speed of experimentation. Strong semantic governance improves trust and reuse, but it can slow rapid prototype work if every change requires heavy review.

    • Abstraction versus fidelity. A high-level model is easier to use, but some predictive use cases need raw event detail, equipment states, and time-series resolution that cannot be oversimplified.

    When it helps most

    A semantic model is most valuable when you expect multiple analytics or AI use cases over time, especially where the same operational concepts recur across plants or functions. Typical examples include predicting quality escapes, identifying bottlenecks, estimating late order risk, forecasting maintenance issues, and supporting engineering or quality investigations with contextual search.

    If the goal is a single narrow report with one clean source system, a full semantic layer may be more structure than you need. But if the roadmap includes cross-functional analytics, machine learning, or natural-language access to operational data, the semantic model usually becomes foundational.

    The short answer is yes, it supports future AI and predictive analytics use cases, but only as an enabling layer. The actual value depends on source data quality, integration reliability, governance maturity, and whether the model is maintained as systems, processes, and controlled definitions change.

  • How does a normalized KPI layer help with root cause analysis?

    A normalized KPI layer helps root cause analysis by reducing argument over the numbers before analysis even starts. In most plants, different systems calculate downtime, yield, scrap, cycle time, or first pass metrics differently. A normalized layer applies consistent definitions, mappings, and calculation rules so teams can compare performance across assets, products, shifts, sites, and time periods without mixing unlike measures.

    That matters for root cause analysis because it improves signal quality. When the KPI layer is well designed, you can separate three questions more reliably:

    • Is the problem real, or is it a reporting artifact?
    • Where in the process or system landscape does the deviation actually appear?
    • What upstream conditions tend to precede it?

    In practice, a normalized KPI layer usually helps in five ways:

    • Consistent event classification. It maps local codes and vendor-specific states into a common structure, so one line’s microstop is not another line’s planned downtime.
    • Cross-system correlation. It links production, quality, maintenance, and sometimes ERP or planning data, making it easier to see whether a throughput drop aligns with a material shortage, an inspection hold, a tool issue, or a routing change.
    • Time alignment. It puts events on a common timeline, which is essential when looking for leading indicators and sequence of failure.
    • Context preservation. It keeps product, part, lot, route, machine, operator, shift, and revision context attached to performance data, so analysis is not limited to generic averages.
    • Traceability back to source. It lets investigators drill from a KPI deviation into the underlying records instead of treating dashboards as evidence on their own.

    That said, a normalized KPI layer does not perform root cause analysis by itself. It narrows the search space and reduces false leads. The actual cause still has to be tested against process knowledge, equipment behavior, material history, quality events, and controlled changes. If the source data is incomplete, poorly timestamped, manually overridden, or inconsistently coded, normalization can make the reporting cleaner without making the conclusion more trustworthy.

    Where it helps most

    It is especially useful when the same issue appears differently in different systems. For example, a yield loss may look like an operator problem in MES, a late release issue in ERP, or an inspection bottleneck in QMS depending on which dataset is viewed first. A normalized KPI layer can expose that these are related manifestations of the same underlying condition rather than separate problems.

    It also helps in brownfield environments where plants run mixed MES, ERP, historian, CMMS, QMS, and spreadsheet-based reporting. In those settings, full replacement is often unrealistic because of qualification burden, validation cost, downtime risk, integration complexity, and long equipment lifecycles. A normalized KPI layer is often used as a coexistence approach: standardize meaning first, then improve local systems over time. That is usually more practical than trying to rip out validated or deeply embedded systems just to get cleaner analytics.

    Key limitations and tradeoffs

    • Normalization can hide local nuance. If the common model is too generic, important line-specific failure modes may be collapsed into broad categories.
    • Governance matters. If definitions are not version-controlled and change-controlled, teams can lose trust quickly.
    • Latency matters. A batch-refreshed KPI layer may support weekly RCCA but not real-time intervention.
    • Correlation is not causation. A normalized layer can show strong associations that still require process validation before action.
    • Data lineage is essential. In regulated environments, investigators need to trace a KPI back to source records, calculation logic, and revisions to support review and repeatability.

    The practical answer is that a normalized KPI layer improves the quality and speed of root cause analysis when it is built with clear definitions, robust mappings, time synchronization, and traceable links to source systems. If those foundations are weak, it may only standardize confusion.