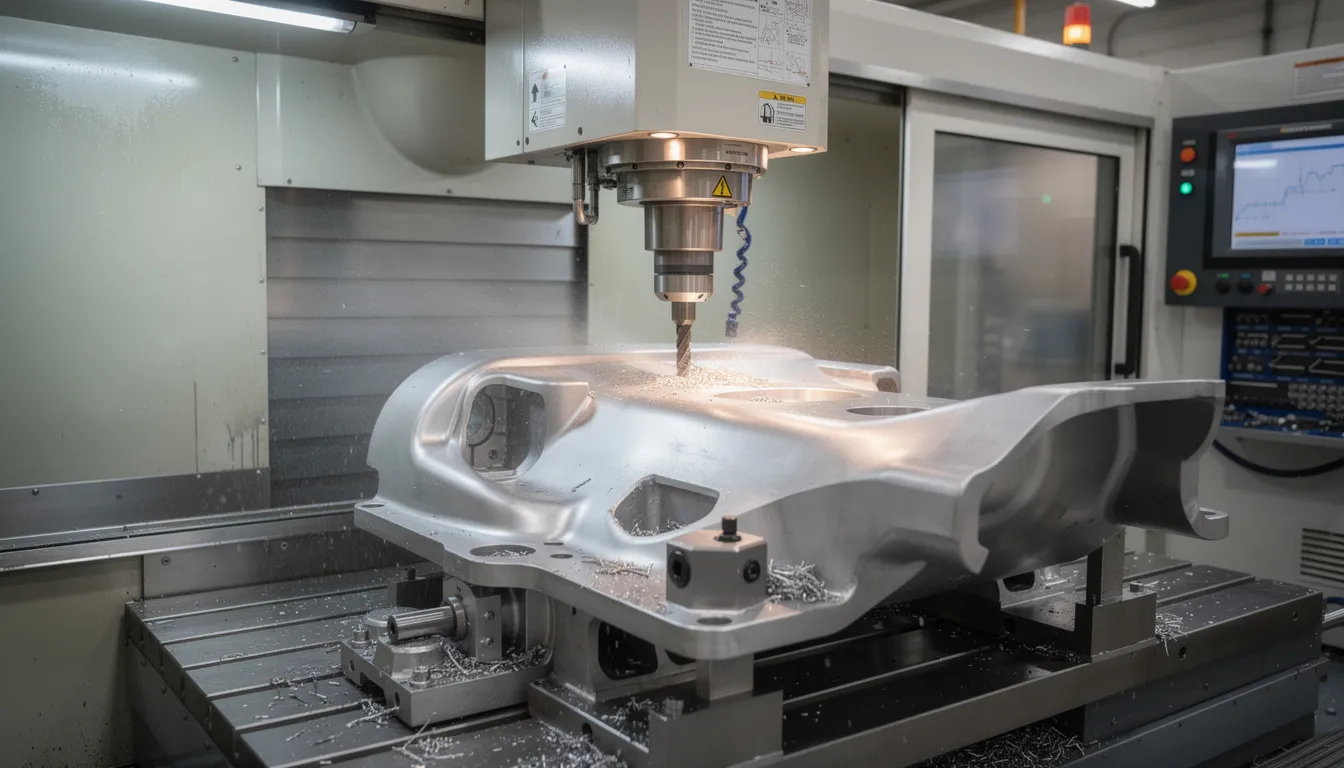
RSC Cluster: Reducing Scrap, Rework, and Material Waste in Aerospace Manufacturing with MES

  • What are the Key Performance Indicators for the manufacturing industry?

    There is no single universal KPI set that fits every plant or regulatory context, but most manufacturing organizations converge on a few KPI families. The important decisions are which KPIs you standardize, how you define and calculate them, and how reliably you can source and govern the data in your existing systems.

    1. Safety & compliance KPIs

    These are usually treated as non-negotiable and reported at the highest level:

    • Recordable incident rate (e.g. TRIR): Number of recordable incidents per standard hours worked.
    • Lost time injury frequency rate (LTIFR): Lost time cases per standard hours worked.
    • Near-miss reporting rate: Near-misses reported per person or per hours worked.
    • Audit findings: Count and severity of internal/external EHS or regulatory findings.
    • Training completion / qualification status: % of employees current on required training for their roles and processes.

    In regulated environments, definitions must be aligned with applicable standards and your internal procedures, and you should not assume that any KPI proves compliance.

    2. Quality KPIs

    Quality indicators need clear traceability to products, batches, work orders, and processes:

    • First Pass Yield (FPY): % of units that meet requirements without rework or repair at a specific operation or end-of-line.
    • Rolled Throughput Yield (RTY): Probability a unit passes through all required steps without defect; sensitive to how routes and rework loops are modeled.
    • Scrap rate: Scrap units or scrap value as a % of total produced or total material issued.
    • Rework / repair rate: % of units that require rework, and associated labor and material cost.
    • Nonconformance rate: Number of nonconformances (NCRs) per lot, per 1,000 units, or per revenue; often split by severity.
    • Customer return rate / field failure rate: RMA rate, warranty returns, or failures in service per installed base.
    • Cost of Poor Quality (COPQ): Internal and external failure costs (scrap, rework, concessions, returns, containment) as % of sales.

    These depend strongly on MES/QMS integration, part and revision discipline, and how rework routes and deviation processes are modeled. In many brownfield sites, some elements of COPQ remain manual or estimated.

    3. Delivery & reliability KPIs

    These measure whether you deliver what was promised, when it was promised:

    • On-Time Delivery (OTD): % of orders or lines delivered on or before confirmed date. Be explicit about whether you use requested date, promised date, or last-committed date.
    • Schedule adherence: % of planned work orders executed as scheduled (by day/shift/week).
    • Lead time: Total time from order release to ship, typically segmented into queue, processing, inspection, and waiting time.
    • Throughput: Units or standard hours shipped per period from a line, cell, or value stream.
    • Backlog / past due: Open orders past due date (by count, value, or criticality).

    Delivery metrics often require reconciling data from ERP (order promises), MES (actual start/finish), and WMS/TMS (ship confirmations). Misalignment between these systems is common and needs to be resolved or at least documented.

    4. Asset & productivity KPIs

    These focus on equipment, labor, and overall productivity of the manufacturing system:

    • Overall Equipment Effectiveness (OEE): Availability × Performance × Quality for a given asset or line. OEE is only meaningful when run rules, planned vs unplanned downtime, and speed losses are defined clearly.
    • Availability / uptime: % of planned time the equipment is able to run (excluding defined planned stops if that is your convention).
    • Cycle time vs standard: Actual processing time compared to engineered standards, often by operation and product family.
    • Capacity utilization: Actual productive time vs available capacity, typically measured in standard hours.
    • Labor productivity: Output per direct labor hour, or value-added hours vs total paid hours.

    Automated OEE and capacity metrics depend on reliable machine connectivity and stable master data (routings, standard cycle times). In mixed-vendor or legacy environments, partial automation plus disciplined manual capture is common.

    5. Cost & efficiency KPIs

    Finance- and operations-oriented KPIs are often used together, but may be calculated differently in ERP vs plant tools:

    • Unit manufacturing cost: Direct labor, material, and overhead per unit, sometimes segmented by product family.
    • Labor cost per unit / per hour: Direct labor cost relative to output.
    • Overtime rate: % of labor hours that are overtime, by department or shift.
    • Inventory turns: Cost of goods sold divided by average inventory; often broken out for raw, WIP, and finished goods.
    • WIP age / cycle stock: Average age of WIP lots, highlighting slow-moving or stuck orders.

    Cost KPIs require agreement between operations and finance on cost models, allocation rules, and which numbers are authoritative. Attempting to bypass ERP cost structures with plant spreadsheets usually creates reconciliation and audit issues.

    6. Maintenance & reliability KPIs

    For asset-intensive environments, maintenance KPIs are central to uptime and quality:

    • Mean Time Between Failures (MTBF): Average run time between unplanned failures for a given asset.
    • Mean Time To Repair (MTTR): Average time to restore equipment to service after a failure.
    • Planned vs unplanned maintenance ratio: % of maintenance hours that are planned/preventive vs reactive.
    • Maintenance compliance: % of preventive maintenance tasks completed on time.

    Accurate maintenance KPIs depend on disciplined use of the CMMS/EAM system and consistent failure coding. Connecting these data to quality and OEE metrics adds value but increases integration complexity.

    7. How to choose and implement KPIs in regulated, brownfield environments

    Instead of adopting a long generic list, most high-performing plants deliberately limit and standardize their KPIs:

    1. Select a critical few per level: For example, 5 to 10 KPIs per plant or value stream, with clear owners.
    2. Define each KPI rigorously: Numerator, denominator, time basis, data source systems, filters (e.g. include/exclude rework, trials), and responsible owner.
    3. Align with existing systems: Use ERP, MES, QMS, CMMS, and historian as your system of record where possible. Avoid creating KPIs that depend on unvalidated side systems if they influence decisions in regulated processes.
    4. Validate calculations: In regulated environments, treat KPI logic changes like any other configuration change: documented requirements, testing, approvals, and controlled deployment.
    5. Respect change control and lifecycle: Replacing existing KPI tools or dashboards outright can trigger revalidation, retraining, and audit questions. Phased coexistence, with side-by-side comparisons, is often safer than big-bang replacement.
    6. Document limitations: Be explicit where data are incomplete (e.g. manual downtime classification on certain machines, partial genealogy in legacy routes) so leadership interprets KPIs correctly.

    8. Typical KPI set for a regulated manufacturing plant

    Many regulated plants end up with a core set similar to the following, tailored to their processes:

    • Safety: TRIR, LTIFR, near-miss rate
    • Quality: FPY, scrap rate, NCR rate, COPQ (at least partially quantified)
    • Delivery: OTD, schedule adherence, lead time for key product families
    • Assets: OEE or uptime for bottleneck assets, capacity utilization
    • Cost: Unit manufacturing cost trend, inventory turns, overtime rate
    • Maintenance: MTBF/MTTR and planned vs unplanned ratio for critical equipment

    The exact KPIs should be driven by your dominant risks (regulatory exposure, complex genealogy, supply reliability, capital intensity) and by what your existing systems can support reliably without compromising traceability or introducing uncontrolled shadow data.

  • NCR vs MRB vs CAPA: How They Work Together in Aerospace Quality Workflows

    NCR vs MRB vs CAPA: How They Work Together in Aerospace Quality Workflows

    In real aerospace operations, NCR, MRB, and CAPA are not isolated quality terms. They are connected handoffs in the same quality control process, moving from defect detection to product disposition to systemic improvement.

    The practical sequence is simple: Detect → NCR → MRB → sometimes CAPA → closure and learning. The value comes from knowing where each step starts, where it stops, and when the next step becomes necessary.

    1. Overview: NCR vs MRB vs CAPA in One Workflow (Answer the Query Fast)

    In quality management, an NCR documents defects, the MRB evaluates non-conforming materials, and the CAPA addresses underlying causes. That is the cleanest way to understand ncr vs mrb vs capa in aerospace manufacturing and MRO.

    NCR is the first formal record when a nonconforming product, process deviation, or documentation issue fails a requirement. MRB is where a cross functional team determines what to do with that specific material. CAPA is the structured system used to determine root cause, take corrective actions, add preventive action where needed, and prevent recurrence.

    NCR, MRB, and CAPA are interconnected quality management frameworks designed to manage product or process defects. In AS9100, FAA, and EASA environments, this workflow must be well defined, documented, risk based, and supported by objective evidence. Connect981, also known as C-981, supports all three in one system so quality, production, engineering, and suppliers can see the same NCR → MRB → CAPA chain.

    An aerospace technician is carefully inspecting a metallic aircraft component on a clean shop floor, emphasizing the importance of quality control processes and risk management in aerospace manufacturing. This thorough investigation is crucial for ensuring high-quality products and addressing any potential quality issues effectively.

    2. Core Definitions in Service of Workflow Clarity

    Definitions matter only if they clarify the workflow. The question is not “what does each acronym mean?” The better question is: what does each step control, and when does the work move forward?

    2.1 NCR: The Trigger Point in the Quality Workflow

    Nonconformance Reporting (NCR) is a critical process in quality management systems that helps organizations identify and document deviations from expected standards or specifications. NCRs are opened whenever a nonconforming product, process problem, or documentation gap is detected against customer requirements, a drawing, a contract clause, or a quality standard.

    An NCR might capture a mis-drilled hole pattern on a 737 wing rib found on 12 March 2024 during in-process inspection. It might capture incorrect heat-treatment certification from a supplier on a landing gear forging at incoming inspection. It might also come from final inspection, MRO teardown, internal audits, customer complaints, or field returns.

    A useful NCR includes part number, serial or lot number, work order, specification, defect description, immediate actions, containment status, and risk assessment flag. In many organizations, NCRs originate in ERP, MES, QMS, email, or paper. Connect981 can centralize these inputs so quality data is not lost before the next decision point.

    2.2 MRB: Structured Disposition for the Specific Nonconforming Material

    The material review board is the cross-functional decision forum that evaluates the NCR record and the affected product. The MRB is a cross-functional team that decides what to do with non-conforming material that cannot be easily fixed.

    The MRB determines the fate of defective items through actions such as scrapping, reworking, or returning to the vendor. Common mrb decisions include rework to drawing, repair through approved data, use-as-is with documented risk justification, scrap, or return to supplier.

    The MRB question is narrow and practical: what can be safely done with this hardware now? It is not a full systemic investigation. MRB decisions focus on safety, airworthiness, fit, form, function, traceability, and whether customer or OEM approval is required.

    2.3 CAPA: Systemic Corrective and Preventive Actions

    CAPA stands for ‘corrective and preventive action’, which is a systematic approach used in regulated industries to identify, investigate, and address problems or non-conformities in products, processes, and systems. The practical capa meaning is this: CAPA changes the system so the same failure mode is less likely to happen again.

    The capa process is opened when repeat NCRs, serious risk, audit findings, supplier trends, or customer feedback suggest a systemic problem. A robust CAPA process should include steps for creating a CAPA request, reviewing it, initiating it formally, investigating the root cause, and verifying the effectiveness of the actions taken.

    Effective CAPA management requires a cross-functional team to oversee the investigation and resolution of issues, ensuring that all relevant perspectives are considered. That team must approve capa actions, maintain capa records, and confirm capa effectiveness through a verification step, not just implementation evidence.

    The CAPA process is crucial for maintaining compliance with quality management system standards, such as ISO 9001, and is often evaluated during external audits. In aerospace and medical devices, a robust quality management system (QMS) is essential for ensuring compliance with industry standards and regulations, particularly where adherence to standards like AS9100 and ISO 13485 is critical.

    Quality management systems must include clear documentation and control processes to ensure that all procedures are followed and that changes are properly managed throughout the product lifecycle. Continuous improvement is a key principle of quality management systems, which involves regularly assessing and refining processes based on internal audits and customer feedback to enhance product quality and compliance.

    3. The Actual Sequence: From Detection to NCR, MRB, and (Sometimes) CAPA

    The order is operational, not theoretical. An operator, inspector, supplier quality engineer, or MRO technician detects an issue. The immediate issue is contained. The NCR is created. The MRB decides the product disposition. Then the organization determines whether a formal capa is required.

    Sequence diagram logic: Operator → NCR → MRB → CAPA or No CAPA → updated procedures, training, risk files, and closure.

    Key steps:

    1. Detect an issue on the shopfloor, at receiving, during test, in the field, or during MRO.
    2. Contain the affected product and document the NCR.
    3. Route the NCR to MRB for technical evaluation and disposition.
    4. Determine whether the event is isolated or systemic using trends, risk analysis, recurrence, and customer impact.
    5. If needed, open a CAPA investigation with root cause analysis and an action plan.
    6. Close the loop by confirming MRB disposition, verifying CAPA effectiveness, and updating control plans, training, and risk registers.

    Consider an A320 assembly line with repeated torque-out defects on titanium fasteners. The first NCR leads to MRB rework. The second NCR leads to another rework decision. By the third similar event from the same supplier, the pattern points beyond one lot. CAPA becomes necessary because the production process or supplier control process may be unstable.

    A thorough investigation might find improper furnace calibration at the supplier. Corrective and preventive actions could include supplier calibration controls, revised incoming inspection checks, updated work instructions, and tighter supplier scorecards. Connect981 can visualize this chain across programs and suppliers, giving quality and supply chain management one view of NCRs, MRB outcomes, and CAPA status.

    Technicians are gathered around an inspection bench, meticulously reviewing aircraft fasteners and precision tools as part of the quality control process in aerospace manufacturing. This collaborative effort highlights important quality system elements and the commitment to continuous improvement and risk management.

    4. Decision Boundaries: When You Stop at NCR/MRB and When You Escalate to CAPA

    A major source of confusion in ncr vs mrb vs capa is the assumption that every NCR must become CAPA. That is not a robust process. It creates backlog, weak problem solving, and shallow corrective actions.

    You may stop at NCR plus MRB when the cause is obvious, risk is low, impact is local, and recurrence is unlikely. A single handling scratch on a nacelle panel may require containment, repair, documentation, and perhaps localized training. It does not automatically justify a full CAPA.

    Escalate to CAPA when root cause is unclear, recurrence is likely, potential risks extend across other products or suppliers, or the issue affects safety, compliance, delivery, or customer satisfaction. Frequent low-severity NCRs can justify CAPA if they reveal process problems or create cost and schedule impact.

    Effective NCR processes require clear definitions of escalation criteria to ensure consistent decision-making across an organization. NCRs should be used to capture not only isolated incidents but also to identify systemic issues that may require corrective actions to prevent recurrence.

    Good boundaries use risk matrices, FMEA scores, program-specific criteria, and documented risk tolerance set by OEMs or airworthiness authorities. This makes sense in multi-site networks where tribal judgment creates variation. Connect981 helps standardize these thresholds while still allowing site-specific controls.

    5. What Not to Conflate: Common Misunderstandings About NCR, MRB, and CAPA

    Many audit findings and quality escapes happen because organizations collapse these distinct concepts into one informal process. The result is incomplete records, weak root cause determination, and poor closure evidence.

    Common errors include:

    • MRB disposition is not corrective action. Rework or scrap fixes the lot, not necessarily the process.
    • NCR closure is not CAPA closure. “Fixed this part” is not the same as “fixed the cause.”
    • CAPA closure is not complete until effectiveness is verified with objective evidence.
    • Preventive actions are not MRB dispositions. They are changes to process, training, design controls, supplier controls, inspection plans, or environmental conditions.

    The separation is simple. NCR documents and controls the event. MRB documents risk based product disposition. CAPA documents system-level corrective and preventive actions and verifies they were properly addressed.

    Under-escalation is dangerous when repeated NCRs are closed through MRB without recognizing a trend. Over-escalation is also a problem because opening CAPA for every routine defect creates fatigue and delays serious investigations.

    For aerospace manufacturing, AS9100 expects control of nonconforming outputs and effective corrective action. For medical devices, FDA 483 observations and warning letters often cite weak capa procedures, poor complaint handling, and failure to verify effectiveness. A well-designed digital workflow separates the steps while keeping traceability between them.

    6. Risk Management Across NCR → MRB → CAPA

    Risk management in quality assurance involves identifying, assessing, and mitigating potential threats to processes to ensure product safety and reliability. A robust risk management process is essential for maintaining compliance with regulatory standards, as it helps organizations proactively address potential quality issues before they escalate.

    Incorporating risk management into the CAPA process is crucial, as it ensures that corrective and preventive actions are aligned with the severity and likelihood of potential risks.

    At each stage, risk changes shape:

    • NCR stage: screen whether the nonconforming product could have escaped, affected airworthiness, violated customer requirements, or created downstream quality problems.
    • MRB stage: determine whether use-as-is, repair, rework, or scrap is justified. Use-as-is should only occur when risk analysis confirms no safety or performance impact.
    • CAPA stage: determine whether the failure mode can affect the entire organization, other lines, other suppliers, or other programs.

    Risk tools may include FMEA, hazard analysis, severity and occurrence scoring, and program-specific control plans. In medical devices, CAPA actions may also update ISO 14971 risk management files. In Connect981, centralized risk data across NCRs, MRB records, and CAPA cases supports predictive analytics and better prioritization.

    7. How NCR, MRB, and CAPA Interact with Supply Chain Management

    Supplier issues are a major source of NCR volume in aerospace. Effective supplier management involves qualifying, evaluating, and monitoring the performance of suppliers to ensure compliance with industry standards and specifications.

    Establishing stringent criteria for supplier selection and ongoing evaluation is crucial for maintaining quality and compliance in aerospace manufacturing. A robust supplier management process includes issuing nonconformance reports (NCRs) when items purchased from suppliers do not meet established specifications, which can lead to corrective actions if issues are systemic.

    A typical supplier workflow starts with an NCR for composite plies out of tolerance, incorrect material certs, or a machined feature outside drawing limits. MRB then decides whether to rework internally, return to supplier, scrap, or expedite replacement. If the same supplier or commodity repeats the issue, CAPA or supplier corrective action becomes appropriate.

    Supplier corrective action requests (SCARs) may be necessary when suppliers repeatedly fail to provide items that meet specifications, indicating a need for more serious intervention. Supplier PPM, on-time delivery, MRB scrap rates, and customer feedback should all feed capa sources.

    Connect981 supports supplier collaboration by sharing controlled NCR, MRB, and CAPA-related information without relying on disconnected spreadsheets or email threads.

    The image depicts a supplier receiving area filled with inspected aerospace parts stored in clearly labeled containers, highlighting the importance of the quality control process and supply chain management in aerospace manufacturing. This organized setup reflects a robust process for managing quality issues and ensuring compliance with customer requirements.

    8. Industry Examples: Aerospace Manufacturing, MRO, and Medical Devices

    The workflow logic is consistent across regulated industries, but the triggers differ.

    In aerospace manufacturing, repeated paint thickness nonconformities on control surfaces for a 2025 production program may start as final inspection NCRs. MRB may allow rework for affected surfaces. If the pattern continues, CAPA adjusts paint process parameters, operator training, spray booth controls, and inspection frequency.

    In aerospace MRO, multiple repair stations may report the same nonconforming repair outcome on an engine component. Local MRB teams disposition the affected hardware, but the trend should roll into a network-level CAPA. The improvement may include revised repair instructions, validation checks, tooling controls, and technician qualification updates.

    In medical devices, nonconforming product, complaint trends, returns, and customer complaints are common CAPA sources under ISO 13485 and FDA expectations. The same distinction applies: NCR identifies problems, MRB-like review controls product, and CAPA addresses the system.

    In all cases, the value comes from relationship clarity. NCRs detect. MRB controls. CAPA transforms the system so organizations can deliver high quality products with better compliance readiness.

    9. Digitalizing the NCR–MRB–CAPA Chain with Connect981

    Brownfield aerospace environments often spread NCR, MRB, and CAPA work across ERP, MES, legacy QMS, file shares, spreadsheets, paper travelers, and email. That fragmentation creates missed escalations, incomplete thorough documentation, delayed approvals, and weak audit trails.

    Connect981 acts as a unified aerospace operations platform. It ingests NCR data from shopfloor execution, inspection, supplier portals, and existing enterprise systems. It routes MRB decisions through configurable zero-code workflows with the right engineering, quality, manufacturing, and supply chain approvals. It links CAPA records to the originating NCRs, MRB decisions, serial numbers, work orders, and production data.

    The practical capabilities are direct:

    • Digital work instructions update when CAPA actions change the process.
    • Parts traceability and serial number control enforce MRB decisions at point of use.
    • Dashboards show NCR trends, MRB scrap versus rework ratios, CAPA aging, supplier performance, and iso audit readiness.
    • AI-assisted root cause analysis helps identify problems earlier and suggests likely contributing factors for review.
    • Automated alerts help teams address problems before overdue tasks become compliance exposure.

    Technology does not replace quality judgment. It gives the quality system a more reliable operating structure. For teams comparing ncr vs mrb vs capa, the goal is not more terminology. The goal is one connected workflow where product and quality problems are visible, decisions are documented, and improvement is measurable.

    To see an end-to-end digital NCR → MRB → CAPA workflow in action, request a demo of Connect981.

  • What does work order management mean?

    Work order management is the end-to-end process for creating, planning, executing, tracking, and closing the work orders that drive production, maintenance, or rework on the shop floor. In regulated manufacturing, it is one of the core mechanisms for translating approved plans and specifications into controlled, traceable work.

    Core elements of work order management

    In an industrial environment, effective work order management typically covers:

    • Work order creation: Generating work orders from demand signals (MRP/ERP), maintenance plans (CMMS), nonconformances, or engineering changes.
    • Definition and routing: Specifying the operations, routings, resources, required materials, tools, and references (BOMs, drawings, work instructions), including revision and effectivity.
    • Scheduling and dispatching: Assigning work orders to lines, cells, machines, or technicians, considering capacity, constraints, and downtime limits.
    • Execution control: Guiding operators or technicians through the defined steps, collecting required data, enforcing holds or checks, and preventing unauthorized deviations.
    • Material and resource tracking: Issuing and backflushing material, tracking serial/lot usage, recording tooling and equipment used where required for traceability.
    • Data capture and evidence: Recording who did what, when, on which resource, to which item, with which parameters and measurements.
    • Completion and closure: Confirming quantities good/scrap, logging nonconformances, updating inventory and WIP, and closing the work order with a complete, immutable record.

    How it fits with MES, ERP, QMS, and CMMS

    In brownfield plants, work order management almost never lives in a single system, and responsibilities differ by site:

    • ERP/MRP typically generates production orders and controls costing, demand, and inventory accounting.
    • MES or dispatch systems often handle execution: dispatching operations, enforcing sequences, and capturing production data.
    • QMS may create and control rework or corrective action work orders tied to nonconformances or CAPAs.
    • CMMS/EAM manages maintenance work orders for assets and facilities.

    Work order management in practice is the coordinated set of processes and integrations across these systems, not just the screen where an operator sees the job.

    Regulated and long-lifecycle considerations

    In regulated or aerospace-grade environments, work order management must account for:

    • Traceability and genealogy: Linking work orders to serial/lot numbers, materials, test results, and inspection records in a way that can be reconstructed years later.
    • Configuration and revision control: Ensuring the work order references the correct, released versions of BOMs, routings, drawings, and work instructions, and that version changes follow change control and validation.
    • Validation and auditability: Demonstrating that the process and systems used to manage work orders are validated (where required) and that records are complete, tamper-evident, and attributable.
    • Long equipment and system lifecycles: Maintaining workable interfaces between newer work order tools and decades-old ERP, PLCs, or custom databases without risky “rip and replace” projects.

    Work order management supports compliance and audit readiness, but by itself does not guarantee any regulatory outcome. The effectiveness depends on process discipline, integration quality, and how the overall quality system is designed and maintained.

    Common failure modes and tradeoffs

    Typical issues when implementing or changing work order management include:

    • Fragmented records: Parts of the work order history end up in ERP, parts in MES, parts in spreadsheets. This complicates investigations, audits, and certification efforts.
    • Overly rigid or overly flexible workflows: Too rigid, and operators create workarounds; too flexible, and you lose control and traceability. Tuning this balance is site-specific.
    • Poor integration and master data quality: Misaligned item masters, routings, or effectivities cause incorrect work to be executed or rework loops.
    • Attempted system replacements: Full replacement of legacy ERP or MES just to “fix work orders” often stalls due to validation cost, downtime risk, and integration complexity. Incremental coexistence (e.g., adding an execution or dispatch layer around existing ERP orders) is more viable in many regulated environments.

    What work order management is not

    • It is not just job scheduling; it includes definition, execution control, and recordkeeping.
    • It is not a compliance guarantee; it is one part of a broader quality and operations system.
    • It is not tied to one specific software product; it is a process that usually spans multiple systems and teams.

    In summary, work order management is the controlled lifecycle of work on the shop floor, from request through documented completion, coordinated across ERP, MES, QMS, and CMMS in a way that preserves traceability, supports validation, and respects the constraints of existing systems and equipment.

  • How does MES waste reduction translate into better margins on fixed-price contracts?

    Why MES-driven waste reduction matters more under fixed-price contracts

    On fixed-price contracts, your revenue is essentially capped once the contract is signed, so you cannot improve margin by charging more; you can only improve it by reducing the true cost to deliver the contracted scope at the contracted quality. In that context, MES waste reduction translates into better margins only when it measurably lowers unit and program-level cost without introducing new failure modes, delays, or compliance risks. Waste reduction typically shows up as lower labor content, less scrap and rework, better first-pass yield, and reduced schedule risk penalties, all of which directly affect margin because the selling price is fixed. However, the size and reliability of the benefit depend heavily on process maturity, the quality of integration with existing systems, and whether the underlying work content is actually compressible without harming compliance or robustness.

    How MES waste reduction typically shows up in the cost structure

    In most regulated manufacturing environments, MES-driven waste reduction converts into margin through a few main levers: less direct labor time per unit, lower scrap and rework rates, reduced use of expensive consumables, and fewer schedule disruptions that drive premium freight or overtime. When MES improves routing accuracy, work instructions, and constraint visibility, it can reduce waiting, re-queues, and mis-processing that are otherwise hidden in overhead. Better traceability and data capture also reduce the effort needed for investigations, concessions, and documentation, which is non-trivial on complex fixed-price programs. That said, some savings appear in overhead pools rather than direct unit cost, and depending on your costing model, you may not see a clean one-to-one translation in standard cost or program P&L without re-baselining and finance alignment.

    Labor and throughput: when time savings really turn into margin

    MES often claims to reduce non-value-added labor (searching for information, re-entering data, waiting on approvals) and increase throughput, but those improvements only turn into real margin if headcount or overtime is actually reduced or more contracted work is run with the same staffing. If time savings are simply absorbed as additional “buffer” or used for unplanned tasks, margin impact will be limited even if the process feels smoother. In fixed-price environments, increased throughput can enable you to deliver milestones on time or earlier, reducing liquidated damages risk and avoiding costly recovery plans. However, in low-volume, high-mix or aerospace-grade programs, staffing is often dictated by skill and certification constraints, so fully monetizing labor time savings can be harder than it looks on paper. You need a deliberate plan—fewer weekend shifts, less overtime, defer hiring, or reassign staff to incremental revenue work—to convert time savings into measurable financial margin.

    Scrap, rework, and quality escapes: direct cost impact and risk reduction

    Scrap and rework are among the most direct ways MES waste reduction influences margin on fixed-price contracts, especially when parts are expensive or lead times are long. By enforcing correct revisions, tighter process controls, and clear electronic work instructions, MES can reduce mis-builds and off-spec production, lowering both material write-offs and rework labor. Better in-process checks and automated data capture also reduce the probability and impact of quality escapes, which in fixed-price contracts can lead to uncompensated field fixes or post-delivery retrofit work that erodes margin. At the same time, over-automating checks or adding too many electronic signoffs can increase cycle time and operator burden if not well designed, offsetting some of the gains. The net margin effect depends on striking a balance where quality risk is materially reduced without turning every operation into a bottlenecked approval workflow.

    Schedule adherence, penalties, and cost of recovery

    For fixed-price contracts with milestone-based payments, MES waste reduction often shows up financially as improved schedule adherence and lower cost of recovery when things go wrong. Better real-time visibility into WIP, constraints, and deviations can reduce unplanned downtime and help you respond earlier to issues, avoiding last-minute overtime, premium freight, and parallel rework paths needed to catch up. In some contracts, late delivery penalties or delayed payment milestones cut directly into program margin, so even small improvements in flow and predictability can have outsized financial impact. However, MES alone does not eliminate supplier risk, engineering churn, or test failures, which are common root causes of schedule slip on complex programs. Margin protection in this area comes from integrating MES data with planning, supplier management, and change control, not from MES in isolation.

    Overhead, IT cost, and when MES can erode margins instead

    MES waste reduction is not free; license fees, integration work, validation, and ongoing support increase your IT and overhead burden, which can offset savings if not carefully managed. In heavily regulated environments, the cost of validating changes, managing electronic records, and supporting audits can rise significantly when you digitize more of the process, even as you reduce shop-floor waste. If MES is implemented with heavy customizations or brittle integrations to legacy ERP, PLM, and QMS, the ongoing maintenance and change control costs can eat into program margins every time a contract requirement, part configuration, or process changes. On smaller or shorter-duration fixed-price contracts, the payback window may be too short to recover initial MES-related investments, so it is common to focus MES-driven waste reduction on long-running platforms or product families where the cumulative margin impact justifies the overhead.

    Brownfield reality: why MES waste reduction won’t fix every margin problem

    In typical brownfield environments, MES is layered over existing ERP, PLM, QMS, and homegrown tools, so waste reduction is constrained by integration quality and data hygiene. If routing data, BOMs, or quality rules are inconsistent or out of date, MES can propagate bad information faster, actually increasing scrap or rework until upstream processes are stabilized. Many fixed-price programs also rely on legacy equipment with limited connectivity and qualification histories, making full automation or real-time data capture impractical without costly retrofits and re-qualification. Full system replacement to chase theoretically higher waste reduction often fails in aerospace-grade settings due to validation burden, downtime risk, and re-qualification of processes and equipment, which can dwarf potential margin gains in the short to medium term. Realistic strategies focus on incremental MES use—targeted at known high-waste operations—while coexisting with legacy systems and preserving validated processes.

    Connecting MES waste reduction to contract and program economics

    To see margin improvement under fixed-price contracts, you need a clear mapping from MES-enabled waste reduction to your cost model and contract structure. That usually means identifying specific high-cost waste categories (scrap on certain parts, chronic rework loops, recurring overtime triggers) and quantifying how MES interventions will change those patterns, then tracking them with stable metrics. Finance and program management must agree on how labor savings, overhead changes, and risk reductions will be recognized in margin, rather than assuming any OEE or cycle time improvement automatically improves profitability. For long-duration or multi-year contracts, you also need to account for learning curves and design changes, which can either amplify or dilute the effect of MES-driven waste reduction over time. Without this explicit linkage, MES may visibly improve operations while the P&L for fixed-price programs shows little or no margin shift, leading to skepticism despite real, but misaligned, operational gains.

  • What are the 7 main functions of operations management?

    The “7 functions of operations management” is a teaching model. Different texts use slightly different labels, but in industrial, regulated environments the core functions can be understood as:

    1. Planning

    Planning translates demand and product requirements into feasible operations.

    • Capacity and resource planning (equipment, labor, tooling, fixtures).
    • Production planning and scheduling, often across MES/ERP/MRP.
    • Maintenance and calibration planning to protect validated states.

    In brownfield plants this is constrained by legacy ERP/MES, frozen validated configurations, and limited ability to change routings or takt times without formal change control and potential revalidation.

    2. Organizing

    Organizing defines how work is structured and controlled.

    • Defining production lines, cells, and work centers within existing layouts.
    • Allocating responsibilities across operations, quality, engineering, and IT.
    • Documenting standard work, work instructions, and handoffs between systems (e.g., PLM to MES to QMS).

    In regulated environments, organizing is strongly influenced by requirements for segregation of duties, electronic signatures, and traceability, which may limit how flexibly roles and workflows can be rearranged.

    3. Staffing and Workforce Management

    Staffing focuses on having the right skills, at the right time, on validated processes and equipment.

    • Defining competency requirements for operators, technicians, and supervisors.
    • Training and qualification tracking, often integrated with LMS and QMS.
    • Shift patterns, cross-training, and backup coverage for critical operations.

    Any changes to staffing models that affect who can execute or release product typically require updates to controlled procedures, training records, and in some cases re-approval by quality or regulatory functions.

    4. Directing and Coordination

    Directing covers day-to-day control of operations.

    • Issuing work, dispatching orders, and resolving constraints on the shop floor.
    • Short-interval control, tier meetings, and escalation paths.
    • Coordinating with maintenance, engineering, quality, and supply chain to keep flow stable.

    In reality this often means working around fragmented systems (MES, CMMS, QMS, manual boards) and aligning them without disrupting validated data flows or electronic records.

    5. Controlling and Performance Management

    Controlling focuses on measuring performance and keeping operations within defined limits.

    • Monitoring throughput, OEE, scrap, rework, and adherence to plan.
    • Tracking nonconformances, deviations, and corrective actions via QMS.
    • Ensuring process parameters stay within qualified ranges and are traceable.

    In regulated settings, changing KPIs, dashboards, or data sources is not purely a business decision; it can affect audit trails, data integrity, and how evidence is produced for regulators or customers.

    6. Coordinating Supply, Materials, and Technology

    Many “7 functions” lists separate purchasing or supply from operations. In manufacturing plants, the relevant function is coordinating materials and enabling technologies so operations can run as planned.

    • Aligning material availability (MRP, suppliers, outside processing) with production schedules.
    • Coordinating engineering changes (from PLM) with inventory, tooling, and WIP.
    • Managing introduction and coexistence of new systems (e.g., new MES module) with legacy stacks without breaking traceability.

    Full replacement of core systems to improve this coordination is often risky and slow due to qualification burden, downtime constraints, and integration complexity. Incremental integration or modular overlays are more common than wholesale rip-and-replace.

    7. Continuous Improvement

    Continuous improvement focuses on systematically reducing waste, risk, and variability.

    • Applying Lean, Six Sigma, and problem-solving methods to defects, delays, and safety issues.
    • Driving CAPA and improvement projects through QMS and change control.
    • Optimizing flows without invalidating existing qualifications or product approvals.

    In regulated environments, improvements must be balanced against revalidation cost, change-control overhead, and the need to maintain historical comparability of data. Some technically attractive changes are deferred because the validation burden or downtime risk is too high.

    How strict is the list of 7 functions?

    The “7 functions” is not a universal standard. Some organizations combine or rename these (for example, merging planning and organizing, or splitting controlling into quality control and cost control). In a real plant, operations management is shaped by:

    • Legacy system landscape (ERP, MES, PLM, QMS, CMMS, SCADA).
    • Regulatory obligations and audit expectations.
    • Existing qualifications and certified processes that are expensive to change.
    • Local management structure and labor context.

    When you map your own operations to these 7 functions, use them as a framework to clarify responsibilities, interfaces, and constraints, not as a rigid taxonomy. The useful question is less “Do we have these 7?” and more “For each of these functions, who owns it, how is it executed today, and what are the risks and bottlenecks?”

  • What is sustainability in aerospace?

    In aerospace, sustainability is the systematic reduction of environmental and resource impacts across the full lifecycle of aircraft, spacecraft, and components, while preserving safety, regulatory compliance, performance, and economic viability. It is not limited to fuel burn or CO₂ emissions; it also includes how materials are sourced, how parts are manufactured and maintained, and what happens at end of life.

    Key dimensions of sustainability in aerospace

    • Environmental performance of products
      • Lower fuel burn and emissions through aerodynamics, weight reduction, and propulsion efficiency.
      • Adoption of sustainable aviation fuels (SAF) and, where feasible, electrified or hybrid propulsion.
      • Reduced noise and local air-quality impacts near airports and test facilities.
    • Sustainable materials and supply chain
      • Use of lower-impact materials, recycled content, and reparable designs where certifiable.
      • Tighter control of conflict minerals, hazardous substances, and waste streams.
      • Supplier qualification that considers environmental performance alongside quality, cost, and delivery.
    • Manufacturing and maintenance operations
      • Energy-efficient machining, heat treatment, autoclave, and facility operations.
      • Reduction of scrap, rework, and nonconformances to avoid wasted energy, materials, and capacity.
      • Optimized maintenance, repair, and overhaul (MRO) to extend asset life and minimize replacements.
    • End-of-life and circularity
      • Design for disassembly, parts harvesting, and material recovery where certification allows.
      • Traceability that supports reuse, life extension, and responsible recycling rather than landfill.
    • Economic and operational resilience
      • Reducing exposure to energy and material price shocks through efficiency.
      • Managing sustainability risks that can disrupt programs, such as regulatory changes or resource constraints.

    Constraints specific to regulated aerospace environments

    Sustainability in aerospace is tightly bounded by safety and certification requirements. Many apparently simple changes (coatings, lubricants, alloys, process parameters, software) trigger requalification, revalidation, and sometimes recertification. This makes rapid or wholesale technology replacement rare and costly.

    Key constraints include:

    • Safety and airworthiness: Any change that could affect performance, reliability, or failure modes must be validated and documented. Sustainability gains cannot compromise safety margins.
    • Certification and qualification burden: New materials, processes, or digital systems often require test campaigns, paperwork updates, and regulator acceptance. This can slow adoption of more sustainable options.
    • Long asset lifecycles: Aircraft and major tooling often operate for decades. Fleet-wide changes are limited by backwards compatibility, mixed configurations, and retrofit feasibility.
    • Brownfield system reality: Plants rely on legacy MES, ERP, PLM, and QMS platforms with limited interoperability. Sustainability data (energy, scrap, emissions) often sits outside core production systems or in unstructured formats.
    • Constrained downtime: Opportunities to introduce greener processes or equipment are limited by build schedules, qualification windows, and tight capacity.

    How sustainability shows up in manufacturing operations

    For operations, engineering, quality, and IT leaders, sustainability typically becomes concrete through measurable changes in processes and systems rather than broad pledges.

    • Process optimization and yield
      • Reducing scrap, rework, and nonproductive time directly cuts material use and energy per good part.
      • Digital work instructions and robust standard work can reduce human error and associated waste.
    • Energy and resource efficiency
      • Monitoring and optimizing high-energy assets such as autoclaves, ovens, compressors, and test stands.
      • Scheduling and batch strategies that minimize idle running and peak loads.
    • Waste and chemical management
      • Closed-loop control of process chemicals, paints, and surface treatments where regulations permit.
      • Better segregation and documentation of waste streams to enable recycling or reclamation.
    • Data, traceability, and reporting
      • Linking sustainability metrics (e.g., energy per part, scrap by operation) to existing traceability records.
      • Using MES, QMS, and PLM data to support product-level footprint calculations, where data quality allows.
      • Building evidence trails suitable for internal audits and customer inquiries, without promising regulatory outcomes.

    Coexisting with legacy systems rather than full replacement

    In most aerospace environments, pursuing sustainability does not mean ripping out existing MES, ERP, or PLM systems. Full replacement strategies often fail or stall because of:

    • High validation and qualification costs for new software platforms in production contexts.
    • Integration complexity with existing equipment, test stands, and regulatory records.
    • Downtime risk when critical lines depend on stable, known systems.
    • The need to maintain historical traceability and change records over decades.

    Practical sustainability programs usually layer new capabilities on top of or alongside existing systems, for example by:

    • Adding targeted data collection at specific machines or processes to quantify energy, scrap, and rework.
    • Integrating sustainability metrics into existing quality and operations dashboards instead of building parallel systems.
    • Using change control processes to introduce more efficient processes incrementally, tied to scheduled maintenance or capital projects.

    Tradeoffs and failure modes

    Sustainability initiatives in aerospace frequently encounter tradeoffs and can fail if these are not made explicit:

    • Performance versus impact: Lighter or more recyclable materials may have different fatigue, corrosion, or manufacturability characteristics that complicate certification.
    • Local versus lifecycle optimization: Reducing plant energy use might increase upstream energy if it shifts work to less efficient suppliers.
    • Short-term cost versus long-term resilience: Some projects raise near-term unit costs while reducing exposure to future regulatory or resource risks.
    • Measurement burden: Overly complex data requirements can overload teams, produce low-quality data, and undermine both sustainability and compliance objectives.

    A disciplined approach uses existing governance structures (change control, configuration management, PPAP or equivalent, FAI, and internal audits) to evaluate sustainability initiatives alongside safety, quality, delivery, and cost, rather than treating them as separate.

  • Why is waste more costly in aerospace than other industries?

    Direct cost of aerospace materials and components

    Waste is more costly in aerospace partly because the underlying materials and parts are inherently expensive. Aerospace structures and engines use high-grade alloys, composites, and specialized fasteners that carry significant cost per unit and often have long lead times. Scrapping a single large machined titanium part may represent tens of thousands of dollars in purchased material and machining time. Many components are custom or low-volume, so you cannot easily spread the cost across large production runs. As a result, each defect, scrap event, or excessive rework has a disproportionate financial impact compared with high-volume, low-cost sectors.

    Engineering, qualification, and process validation embedded in each part

    Beyond material and labor, each aerospace part carries a large burden of engineering and qualification cost. The processes that make the part—heat treatment, special processes, inspection methods, NC programs—are typically validated and sometimes frozen under configuration control. When a part is scrapped, you are not just losing material; you are losing a unit that consumed qualified capacity, approved methods, and often first-article or partial requalification effort. Higher-than-expected waste rates can trigger reviews of the process validation, PPAP/FAI rework, or additional testing that add cost well beyond the shop floor. In regulated programs, these impacts routinely exceed the visible scrap line on the financial report.

    Traceability, documentation, and investigation overhead

    In aerospace, every nonconformance generates documentation and often a formal investigation, and this overhead amplifies the cost of waste. A single scrapped part can require nonconformance reports, root cause analysis, corrective action plans, and updates to control plans or work instructions. Engineering, quality, manufacturing, and sometimes customer representatives must review and approve these records. If the waste suggests a systemic issue, you may need to perform impact assessments on previously delivered or in-process hardware. This investigative and documentation work is mandatory in many programs and can easily dwarf the cost of the material itself.

    Impact on delivery commitments and customer trust

    Waste in aerospace often translates directly into schedule risk, which is costly in contractual and reputational terms. Many aerospace contracts include liquidated damages, performance penalties, or strict on-time delivery metrics tied to payment milestones. Scrapping a critical part with a 12–20 week lead time can jeopardize a delivery window for an entire aircraft or engine build. Even when penalties are avoided, recurring waste drives expediting, out-of-sequence work, and last-minute rescheduling, all of which add overtime, logistics costs, and risk to downstream operations. Over time, chronic quality-driven waste erodes customer trust and can lead to more audits and tighter oversight, raising ongoing operating costs.

    Safety margins, criticality, and conservative decisions

    Because aerospace parts are safety-critical, the organization is forced to be conservative when dealing with any suspected nonconformance or process drift. Parts that might be reworked or accepted under concession in other industries are often scrapped or subjected to costly extra testing. Engineers may decide to scrap borderline parts rather than carry the residual risk and documentation burden into service. This risk-averse stance is rational given the consequences of a failure in service, but it raises the effective cost of each instance of waste. The system design itself—tolerances, inspection coverage, and safety margins—can make waste more likely and more expensive to manage.

    Brownfield realities: complex flows and rework amplification

    In most aerospace operations, waste does not occur in a simple linear process with modern systems everywhere; it occurs in brownfield environments with mixed equipment, legacy MES/ERP, and manual handoffs. When scrap happens late in the routing, after many special processes and inspections, rework or remake often requires rebooking scarce furnace slots, NDI capacity, or certified operators. Legacy routing and tracking systems may not handle out-of-sequence or parallel rework well, causing planning inefficiencies and manual workarounds. These realities mean each unit of waste can ripple across multiple departments and sites, multiplying cost through lost capacity and coordination effort.

    Why waste reduction is constrained and not a quick win

    Despite the high cost of waste, aerospace plants cannot simply overhaul processes or systems to eliminate it quickly. Aggressive process changes, new equipment, or new software all require qualification, validation, and change control, which are expensive and slow. Replacing legacy systems or radically altering routings often introduces as much risk and disruption as it removes, especially when equipment lifecycles span decades. Many waste drivers are tied to design choices, supply chain variability, and program-specific requirements that cannot be changed unilaterally by operations. As a result, waste reduction is usually incremental and heavily evidence-based, and organizations must plan on living with some level of expensive waste while they improve.

    Implications for how you manage and prioritize waste in aerospace

    Because waste is structurally more costly, aerospace organizations typically focus on prevention and early detection rather than relying on late-stage inspection and scrap. This means investing in robust process capability, error-proofing, stable supply chains, and disciplined root cause analysis, even when the short-term ROI is hard to quantify. Data integration between QMS, MES, and ERP is often a limiting factor in targeting the most impactful waste causes, especially in brownfield environments with fragmented records. Prioritizing waste drivers that affect critical-path parts, qualified special processes, or high-documentation activities tends to yield the best returns. However, any improvement effort must respect configuration control, validation requirements, and limited downtime, which constrains how fast you can move even when the waste looks obviously costly on paper.

  • Material Review Board (MRB) in Aerospace – Dispositions, Authority, and Digital Traceability

    Material Review Board (MRB) in Aerospace – Dispositions, Authority, and Digital Traceability

    In aerospace, a small defect can become a large decision. A burr, porosity indication, missing certificate, corrosion finding, or dimensional deviation can affect safety, delivery, cost, and configuration control. That is why mrb aerospace processes need clear authority, disciplined evidence, and traceable execution.

    Overview: What Is an Aerospace Material Review Board (MRB)?

    A material review board is a controlled authority for evaluating nonconforming material, components, assemblies, raw materials, and records. A Material Review Board (MRB) is a cross-functional team that evaluates nonconforming materials to determine their fate, ensuring decisions are based on quality and safety considerations.

    The material review board MRB is not just a meeting held on a weekly or monthly basis. It is a material review board process embedded in daily operations across OEMs, Tier 1 suppliers, and MRO organizations. It connects the non conformity report, concessions, deviations, engineering analysis, production data, and final disposition.

    Do not confuse this with the Maintenance Review Board (MRB), which governs scheduled fleet-wide maintenance standards in aviation, playing a critical role in maintaining airworthiness. The aerospace material review function focuses on product nonconformance and whether the affected item can move forward.

    AS9100 and regulatory expectations require nonconforming product to be identified, reviewed, approved, and documented by authorized personnel. FAA guidance such as FAA Order 8120.23 reinforces the need for defined MRB authority and objective records.

    Connect981 supports this work by tying ERP, MES, QMS, supplier, and shopfloor data into one traceable mrb process, so the current mrb record is not scattered across emails or shared folders.

    A technician is carefully inspecting an aircraft component on a clean shop floor, ensuring adherence to quality assurance standards. This process is part of the material review board (MRB) procedure, where nonconforming materials are evaluated to determine their disposition and prevent future nonconformance.

    Who Sits on the MRB and What Authority Do They Have?

    An MRB must consist of highly specialized subject matter experts, including stress engineers, quality assurance specialists, and design engineers. The board members usually come from different departments because one function rarely has enough context to decide alone.

    Typical roles include:

    • Quality assurance lead or chair: controls the process, verifies containment, ensures records are complete, and confirms the decision follows procedure.
    • Quality engineers: review inspection evidence, defect history, customer requirements, and audit risk.
    • Design engineer: determines whether the condition affects form, fit, function, or approved design intent.
    • Stress or structural engineer: evaluates metal fatigue, stress loads, damage tolerance, residual margin, and primary structure impact.
    • Manufacturing engineer and mrb engineers: define whether repair or rework can be performed with approved resources, tooling, and instructions.
    • Procurement and supplier quality: coordinate vendor communication, supplier corrective action, and return to vendor disposition.
    • Production or MRO operations: explain routing impact, aircraft access, priority, and cycle time constraints.

    Authority is delegated through a charter, quality manual, customer agreement, or engineering authority letter. Local boards may decide minor issues. Major or safety-critical deviations often require OEM, customer, FAA, or EASA approval. MRB teams are responsible for keeping manufacturing and production lines running smoothly while adhering to stringent structural and airworthiness standards, but they must still challenge schedule pressure when conformity or safety is at risk.

    MRB Process Flow: From Detection to Final Disposition

    The MRB process typically begins with the creation of a Nonconformance Report (NCR) when a defect is identified, which is then reviewed by the board to decide on the appropriate disposition of the nonconforming materials.

    1. Detection: issues may come from incoming inspection, in-process checks, NDT, functional test results, final inspection, supplier notice, or MRO discovery.
    2. Containment: parts are quarantined, tagged “HOLD” or “DO NOT USE,” and blocked in ERP, MES, or WMS to prevent shipment or installation.
    3. NCR creation: the condition is described as is, linked to part number, serial or lot, work order, routing, supplier, photos, inspection reports, and test data.
    4. MRB review: board members examine drawings, specifications, process history, prior nonconformance report records, allowable damage limits, and mrb evidence.
    5. Evaluation: the group must determine whether data is sufficient or insufficient, whether extra inspection is needed, and whether the issue can affect aircraft safety.
    6. MRB decision: the board selects a disposition, defines actions, and records who must approve, perform, and verify the work.
    7. Execution and closure: routing, work instructions, reinspection, supplier response, or scrap controls are completed before closure.
    8. Feedback: recurring issues are linked to corrective action to prevent recurrence.

    In Connect981, this flow is captured in one controlled record, visible to quality, engineering, production, procurement, and suppliers.

    Standard MRB Disposition Paths in Aerospace

    Common dispositions made by the MRB include accepting materials as-is, reworking them, returning them to the vendor, or scrapping them if they cannot be corrected. The Material Review Board (MRB) can recommend several dispositions for nonconforming materials, including use as-is, rework, return to vendor, and scrap.

    • Use as is: If the nonconformity does not affect the product’s form, fit, or function, the MRB may decide to accept the item as-is, which is also known as accepting under concession. In aerospace, this requires engineering rationale and, for structural items, stress review.
    • Rework: When a part is found to be defective, the MRB may determine that it can be reworked to meet the original specifications, provided that the costs and time involved do not disrupt the production process. Rework returns the item to drawing compliance.
    • Repair: Repair is an approved deviation from the original design, such as blended damage, bushings, patches, or doublers. Strict regulatory compliance involves ensuring every repair disposition meets airworthiness standards set by authorities like the FAA and EASA.
    • Regrade or downgrade: materials may move to a lower-criticality use only when allowed, relabeled, and configuration records are updated.
    • Return to vendor: In cases where the defects are significant and affect the product’s quality, the MRB may recommend returning the materials to the vendor for corrective action.
    • Scrap: If the defective materials cannot be reworked or returned, the MRB may decide to scrap them, especially if the financial and time loss does not justify rework or return. Scrap must be documented by quantity, serial, and destruction status.

    Every disposition needs rationale, risk level, required follow-up, and approval trace.

    Material Review Board Documentation and Traceability Requirements

    Each mrb record should include NCR number, part number, serial or lot number, work order, affected aircraft or engine registration for MRO, defect description, detection point, responsible organization, drawings, specifications, and revision levels.

    Evidence includes inspection reports, NDT images, measurement data, supplier certificates, photos, test logs, stress calculations, and engineering approvals. Effective MRB practices require that all decisions regarding nonconforming materials are defensible, meaning that the rationale for each decision must be recorded contemporaneously and linked to objective evidence, ensuring compliance with regulatory standards.

    Traceability must run backward to materials, suppliers, processes, and approved data, and forward to affected assemblies, aircraft, customers, and as-maintained configuration.

    Regulatory requirements mandate that nonconformances are investigated, decisions are justified, and records are complete, particularly in industries such as pharmaceuticals and medical devices, which are governed by 21 CFR regulations. The Material Review Board (MRB) process must integrate with quality management systems to ensure that all decisions regarding nonconforming materials are documented with objective evidence, including e-signatures and secure audit trails, as required by regulations like Part 11 and Annex 11.

    Compliance gaps can arise when MRB documentation is inconsistent, leading to audits being complicated by missing approvals or unclear records.

    Integration of MRB with NCR, CAPA, and Change Management

    MRB is part of the broader quality system, not a separate island. NCRs identify and document the condition. MRB decides the disposition. CAPA addresses why the issue happened and how to prevent recurrence.

    MRB teams contribute to aviation safety by maintaining structural integrity and preventing future failures through root cause analysis. Repeated material review cases may trigger supplier 8D, process changes, updated inspection plans, or engineering change notices. If the same deviation is discussed every monthly basis, the issue is no longer just an MRB workload problem. It is a system signal.

    Connect981 links NCR, MRB, CAPA, and change workflows so leaders can see whether corrective action reduces future risk.

    Digital MRB in Practice: Making Decisions Enforceable and Audit-Ready

    Disconnected data and documentation can slow down MRB processes, as many reviews still rely on spreadsheets or shared folders, leading to confusion about the most current information. Manual routing and follow-up can stall MRB processes, as reliance on people passing forms or forwarding emails can lead to delays if someone is unavailable.

    Digital MRB changes the control point. On-hold parts cannot be issued, installed, or shipped until an approved mrb decision is complete. Role-based access ensures only authorized board members approve dispositions. E-signatures, timestamps, and revision history create the audit trail.

    Limited visibility into patterns of nonconformance can hinder MRB effectiveness, as data scattered across drives makes it difficult to identify recurring issues before they escalate. Dashboards for open cases, scrap value, supplier trends, and cycle time help most manufacturers focus improvement work where it matters.

    An engineer is using a tablet while standing beside various aircraft parts in a maintenance bay, engaging in the material review board process to assess the quality of components. This setting highlights the collaboration of quality engineers and cross-functional teams in managing nonconforming materials and ensuring safety in aerospace operations.

    Examples of Nonconforming Materials and MRB Review Scenarios

    • Machined structural bracket: A hole is 0.020 inch out of tolerance. MRB teams analyze the damage to aircraft parts to understand its nature and extent, focusing on factors such as metal fatigue and stress loads. Stress may approve use as is with serial-specific traceability.
    • Composite panel: NDI finds local porosity or ply misalignment. If allowable limits and margins support repair, an approved scheme is issued. If not, scrap is required.
    • MRO corrosion finding: Corrosion on a wing skin panel is reviewed against OEM repair data and EASA expectations. The repair, inspections, and release records stay linked.
    • Supplier fastener issue: Oversize holes appear across lots. MRB may initially approve rework or repair, then escalate to CAPA when trend data shows recurring supplier risk.

    Best Practices for a Robust Aerospace MRB Process

    • Define written authority, escalation rules, disposition categories, and risk thresholds.
    • Use standardized digital templates for every review and attachment.
    • Train mrb engineers, quality assurance, and board members regularly on AS9100, customer rules, and lessons learned.
    • Keep independence clear. Safety and conformity outrank schedule pressure.
    • Track metrics such as weekly backlog, cycle time, scrap cost, and repeat defects.
    • Link outcomes to work instructions, supplier collaboration, and future process improvements.
    • Treat objective evidence as a best practice, not an audit afterthought.

    How Connect981 Helps Standardize and Scale MRB in Aerospace Organizations

    Connect981 is an aerospace operations platform that unifies NCRs, MRB decisions, CAPA, routing, supplier workflows, and work execution on top of existing ERP, MES, PLM, and QMS systems.

    Zero and low-code tools let quality and manufacturing engineers configure approvals, notifications, and templates without a long IT project. Digital work instructions execute rework and repair consistently, while results and signoffs are captured at the point of work.

    For teams modernizing mrb aerospace processes, the goal is practical: stronger disposition control, clearer decision authority, and audit-ready traceability. Request a Connect981 demo to see how your MRB workflow can be standardized across sites and suppliers.

  • How to write manufacturing work instructions?

    Writing effective manufacturing work instructions in regulated environments is mostly about clarity, unambiguous sequencing, and good control of change. The exact format will depend on your plant, systems, and regulatory context, but there are common elements that usually apply.

    1. Start from the process, not the template

    • Walk the line and observe how the job is actually done today, including variants and workarounds.
    • Map the process at a high level (inputs, key steps, outputs, handoffs).
    • Identify what is safety-critical, quality-critical, and regulatory-critical; these parts need the highest precision in the instructions.
    • Confirm what must be synchronized with other systems (e.g., MES, batch records, QMS forms, ERP pick lists).

    2. Define scope and preconditions

    Each work instruction should clearly state where it begins, where it ends, and what needs to be true before starting.

    • Purpose: Concise statement of what this instruction achieves.
    • Scope: Products, variants, lines, or cells covered. Call out explicit exclusions.
    • Preconditions: Required state before execution (e.g., machine qualified for product X, calibrated tools available, material inspected/released, prior operation complete).
    • Required training/authorization: Roles or qualifications needed to execute or verify steps.

    3. Standardize identification and traceability

    In regulated environments, you will usually need unambiguous document identity and history.

    • Unique document ID and title.
    • Effective date and revision level.
    • Owner (process owner or department) and approvers (e.g., quality, engineering).
    • Linkage to higher-level procedures, control plans, and related work instructions.
    • Reference to governing specifications, drawings, or standards. Avoid copying their content; reference them and control them under document control.

    4. Structure the steps for unambiguous execution

    The main body should be a stepwise sequence that a trained operator can execute consistently under time pressure.

    • Use numbered steps: One major action per step. Keep steps short and command-style (“Do X”), not narrative.
    • Separate steps from notes: Place clarifications or cautions as sub-bullets or clearly tagged text, not mixed into the main action.
    • Define decision points: Use simple, explicit logic (“IF measurement > limit THEN follow rework instruction WI-123”). Avoid implicit decisions.
    • Specify who does what: For each step, clarify role if it could be ambiguous (operator, inspector, maintenance, supervisor).
    • Include acceptance criteria close to the step: For checks or measurements, state limits/tolerances and units in the same place, not in a separate document that is hard to find.
    • Use consistent terminology: Machine names, station numbers, tool IDs, and product names should match system labels and physical labels on the floor.

    5. Include required parameters and data capture

    Work instructions often fail because they omit the exact variables that matter for quality or traceability.

    • Setpoints, torque values, speeds, feeds, temperatures, times, pressures.
    • Measurement methods, tools, and locations (e.g., “Measure OD with micrometer M-123 at Station 4”).
    • Sampling frequency (e.g., first-off, hourly, 100% inspection, per lot).
    • Where and how to record data (MES screen, paper check sheet, eDHR field, QMS form). Avoid dual-entry unless absolutely necessary.
    • Any serial/lot/heat numbers that must be captured for traceability and how to scan or enter them.

    6. Use visuals, but keep them controlled

    Visuals help reduce ambiguity but can create maintenance burden if not controlled.

    • Use photos or diagrams for orientation, part identification, and critical details (alignments, orientation, surface condition examples).
    • Ensure images are version-controlled with the document. Avoid “unofficial” laminated photos taped to machines with different information.
    • Label callouts clearly and ensure terms match the text and engineering drawings.
    • For digital work instructions, confirm screens render correctly on the devices used on the shop floor and are validated where required.

    7. Define safety, quality, and regulatory-critical steps

    Not every step has the same risk. Explicitly flag high-criticality steps.

    • Safety-critical: Steps that, if skipped or done incorrectly, can hurt people. Call out required PPE, lockout/tagout, and hazard controls. Coordinate with your EHS processes.
    • Quality-critical: Steps that directly affect conformance to specification (e.g., torque application, labeling, batch mixing, measurement).
    • Regulatory-critical: Steps that affect batch records, device history records, or other mandated evidence. Be explicit about documentation and signatures (electronic or handwritten) as required by your quality system.
    • For critical steps, consider explicit verification or signoff (e.g., independent check, dual signature, MES enforced step).

    8. Integrate with existing systems instead of assuming greenfield

    Most plants already have some combination of MES, ERP, PLM, and QMS, along with paper or legacy digital instructions. Full replacement of these systems solely to change work instructions is rarely feasible given validation, downtime, and qualification burdens.

    • Confirm where the “official” document of record lives (QMS, PLM, document control system) and keep that as the master.
    • If using MES or digital work instruction tools, link to the controlled document or ensure the content is synchronized and governed by the same change control.
    • Align part numbers, operation IDs, routing steps, and BOMs across systems so instructions refer to consistent identifiers.
    • Avoid parallel, unsynchronized versions (e.g., one version in MES and a different one on paper in a drawer). If dual formats are unavoidable, define which prevails and how they are kept in sync.
    • For legacy machines without networked controls, clarify manual settings, local records, and how they feed into central systems (e.g., operator transcribes paper to MES at end of shift).

    9. Design for maintainability and change control

    Work instructions must evolve with process changes, equipment upgrades, and corrective actions. Poor maintainability is a common failure mode.

    • Keep a clear revision history: what changed, why, who approved, and which lots or timeframes are affected.
    • Minimize duplication: reference common procedures (e.g., general setup, cleaning) instead of copy-pasting them across many instructions.
    • Coordinate updates with related artifacts: control plans, FMEA, inspection plans, training materials, and routing data should be updated in sync.
    • Ensure change control follows your quality system, including impact assessment, risk evaluation, and revalidation where applicable.
    • Plan rollout: how and when operators are trained, how old versions are removed from the floor, and how you confirm that only current versions are accessible.

    10. Calibrate level of detail to the context

    Too much or too little detail can both cause problems.

    • Avoid unnecessary micro-steps: Overly granular instructions are hard to maintain and often ignored.
    • Include detail where variation is harmful: Provide specifics for tasks that historically cause defects, rework, safety incidents, or audit findings.
    • Consider operator skill mix and turnover: Higher turnover or reliance on temporary workers usually requires more explicit instructions and visuals.
    • Be realistic about language and readability: Use language your workforce understands. Translate where necessary and ensure translated versions are controlled and updated.

    11. Validate and pilot before broad release

    In regulated environments, you should treat new or significantly revised work instructions like a change to the process.

    • Pilot with a small group of operators on the actual line using production or representative material.
    • Observe whether steps are followed as written or if they are confusing, skipped, or reinterpreted.
    • Capture feedback on clarity, missing steps, and practical issues (e.g., too many clicks, screen clutter, paper hard to use with gloves).
    • Verify outputs against specifications and control plans to ensure no unintended quality impact.
    • Document the validation or verification activities at a level appropriate to your regulatory requirements.

    12. Common failure modes to avoid

    • Instructions written only from the CAD or process design, not from observing actual work.
    • Version mismatches between drawings, routings, and work instructions.
    • Uncontrolled local copies (printed binders, USB files) that persist after updates.
    • Instructions that are correct but unusable in context (too small font, too many pages, screens that time out too quickly).
    • Digital tools deployed without proper validation or integration, leading to workarounds and shadow processes.
    • Ignoring the impact of changes on training, qualification, and revalidation obligations.

    13. Adapting this to your environment

    The exact structure and approval flow for work instructions will depend on your quality system, regulatory regime, and digital maturity. High-regulation sectors (e.g., aerospace, medical, defense) typically need tighter document control, more explicit traceability, and more formal validation of any digital instruction platforms. Plants with heavy legacy equipment and mixed systems will often move incrementally: standardizing content and structure first, then digitizing instructions where integration and validation can be managed without excessive downtime or requalification risk.

  • What is the integration between MES and ERP?

    In regulated manufacturing, integration between a Manufacturing Execution System (MES) and an Enterprise Resource Planning (ERP) system means a defined, validated exchange of master data and transactional data across a clear boundary: ERP plans and accounts for the work, MES controls and records execution.

    Typical data flows from ERP to MES

    While details vary by vendor and plant, ERP usually sends:

    • Planned orders / production orders: item, quantity, required dates, plant, and sometimes priority or customer references.
    • Bills of material (BOMs): required components, revisions, quantities, alternates, and sometimes effectivity dates. In many environments the master source may actually be PLM, with ERP passing a derived production BOM.
    • Routings / work centers: operation sequence, standard times, work centers, and sometimes resources or tools. Again, source may be ERP or an external process planning system.
    • Material master and basic item data: item codes, descriptions, units of measure, procurement type, and sometimes quality status.
    • Customer / sales order references: where lot- or unit-level traceability to a customer order or contract is required.

    This information lets MES create and manage executable work (e.g., shop orders or operations) with the correct structure and planning context.

    Typical data flows from MES to ERP

    MES returns actual execution data to keep ERP planning, inventory, and costing credible. Common flows include:

    • Production confirmations: quantities produced, scrapped, or reworked against an order and operation, with timestamps.
    • Material consumption: which components, lots, and quantities were consumed, including substitutions and over/under-issues.
    • Inventory movements: finished goods and intermediates moved into stock, WIP transfers, and sometimes location-level updates (if ERP owns inventory).
    • Labor and machine time: operation actuals for costing, capacity analysis, and OEE-related metrics, where ERP is the system of record for cost.
    • Quality results and holds (high level): pass/fail, usage decisions, or holds that affect availability or release of stock, often summarized rather than detailed test data.

    The granularity of feedback depends on what ERP can handle and what has been validated across systems. Many plants keep detailed, record-by-record traceability in MES or a specialized QMS and send only the minimum necessary aggregates to ERP.

    Division of responsibilities

    MES–ERP integration works best when each system has a clearly defined role:

    • ERP: demand management, MRP, purchasing, high-level capacity planning, inventory valuation, and financial accounting.
    • MES: detailed scheduling and dispatching, work-in-process control, detailed traceability, enforcement of work instructions and recipes, in-process quality data capture, and operator guidance.

    In many brownfield plants, some production and quality steps still occur on paper, spreadsheets, or legacy terminals alongside MES and ERP. Integration needs to account for these gaps to avoid double-booking production or creating untraceable material movements.

    Integration patterns and technical options

    Common patterns include:

    • Batch file exchange: scheduled CSV/XML/IDoc transfers, often easier to validate but less real-time. Common in heavily regulated, change-controlled environments.
    • Web services / APIs: more synchronous and near real-time but require tighter change control, versioning, and monitoring to avoid unplanned outages.
    • Message queues / middleware: decouples systems via an integration layer (ESB, iPaaS, or custom broker). Adds robustness and observability but increases architectural complexity.

    The choice affects latency, recoverability, and validation effort. For example, moving from nightly batch to real-time APIs may improve planning accuracy but requires more sophisticated failure handling, rollback strategies, and test coverage.

    Key constraints in regulated, long-lifecycle environments

    MES–ERP integration in regulated or aerospace-grade contexts is constrained by:

    • Validation and traceability: every automated data exchange that affects product, process, or quality records usually needs documented requirements, testing, and change control. Interface logic can be audited.
    • Long equipment and system lifecycles: MES and ERP may be on different upgrade cycles, with decade-old interfaces that cannot be easily reworked without requalification and downtime.
    • Downtime risk: if integration breaks, ERP may plan based on stale data or MES may receive invalid orders. Plants often design manual fallback procedures, which must be realistic and trained.
    • Data ownership and mastership: conflicts arise when BOMs, routings, and quality dispositions exist in multiple systems. Integration must reflect a clear system of record for each object and attribute.

    Because of these constraints, attempts to fully replace either ERP or MES with the other usually fail in regulated environments. ERP modules marketed as “light MES” typically do not handle detailed traceability, complex routing logic, or shop-floor usability at the level needed; conversely, MES rarely replaces the full financial and supply chain scope of ERP. Integration, not replacement, is the realistic long-term strategy.

    Practical scope definition for MES–ERP integration

    When scoping integration, plants with existing systems should make a few decisions explicitly:

    • What is the order of record? Decide whether ERP or MES owns the authoritative production order and status. Avoid dual maintenance of order structures.
    • Who owns WIP and inventory? In some plants, ERP tracks only inventory at the warehouse level, while MES manages WIP and sub-operations. In others, ERP expects operation-level confirmations for costing.
    • What level of traceability is required where? Decide which details stay in MES/QMS (e.g., per-measurement data, signatures) and what summary data must be visible in ERP to support planning and customer commitments.
    • How are exceptions handled? Define how rework, nonconformances, deviations, and unplanned operations are reconciled between systems so that orders and costs stay consistent.

    In a brownfield environment, it is common to integrate incrementally, starting with core flows (orders down, confirmations and material consumption up) and only later adding finer-grained integration, once data quality, processes, and validation practices are stable.